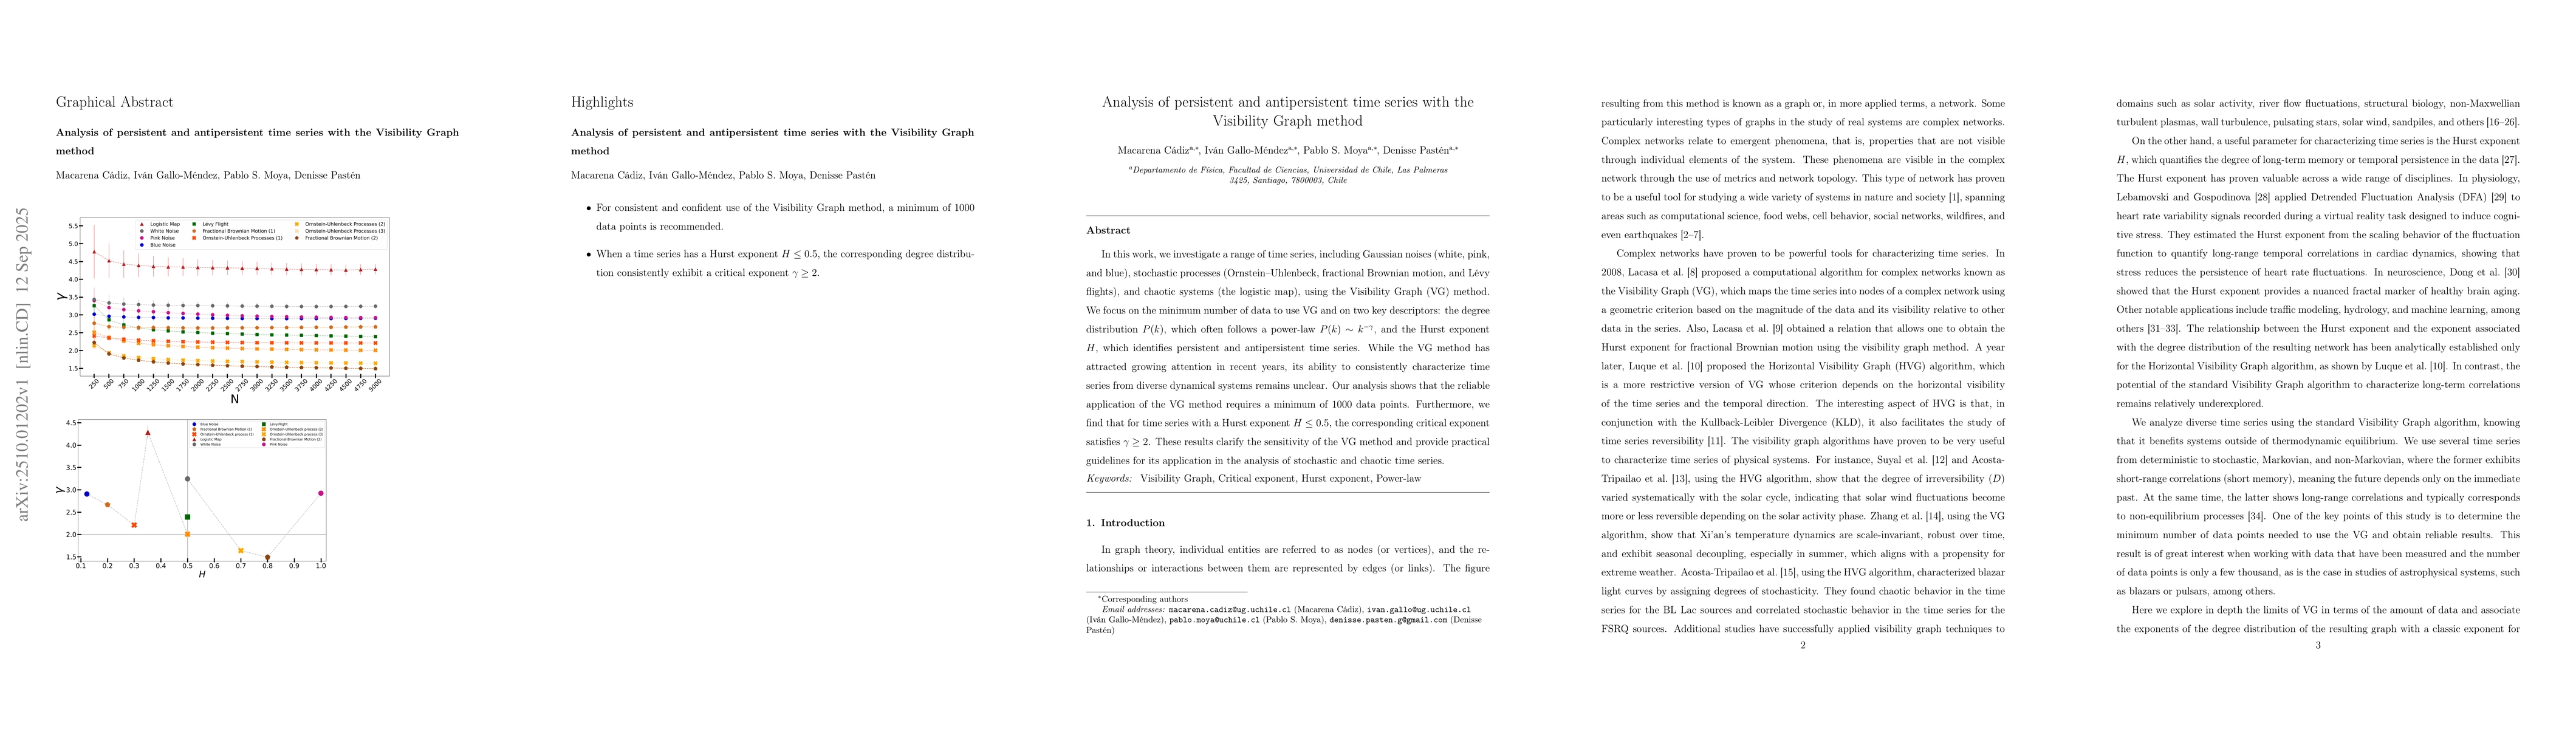
In this work, we investigate a range of time series, including Gaussian
noises (white, pink, and blue), stochastic processes (Ornstein-Uhlenbeck,
fractional Brownian motion, and Levy flights), and chaotic systems (the
logistic map), using the Visibility Graph (VG) method. We focus on the minimum
number of data points required to use VG and on two key descriptors: the degree
distribution P(k), which often follows a power law P(k) ~ k^-gamma, and the
Hurst exponent H, which identifies persistent and antipersistent time series.
While the VG method has attracted growing attention in recent years, its
ability to consistently characterize time series from diverse dynamical systems
remains unclear. Our analysis shows that the reliable application of the VG
method requires a minimum of 1000 data points. Furthermore, we find that for
time series with a Hurst exponent H <= 0.5, the corresponding critical exponent
satisfies gamma >= 2. These results clarify the sensitivity of the VG method
and provide practical guidelines for its application in the analysis of
stochastic and chaotic time series.
Discussion 0