Summary
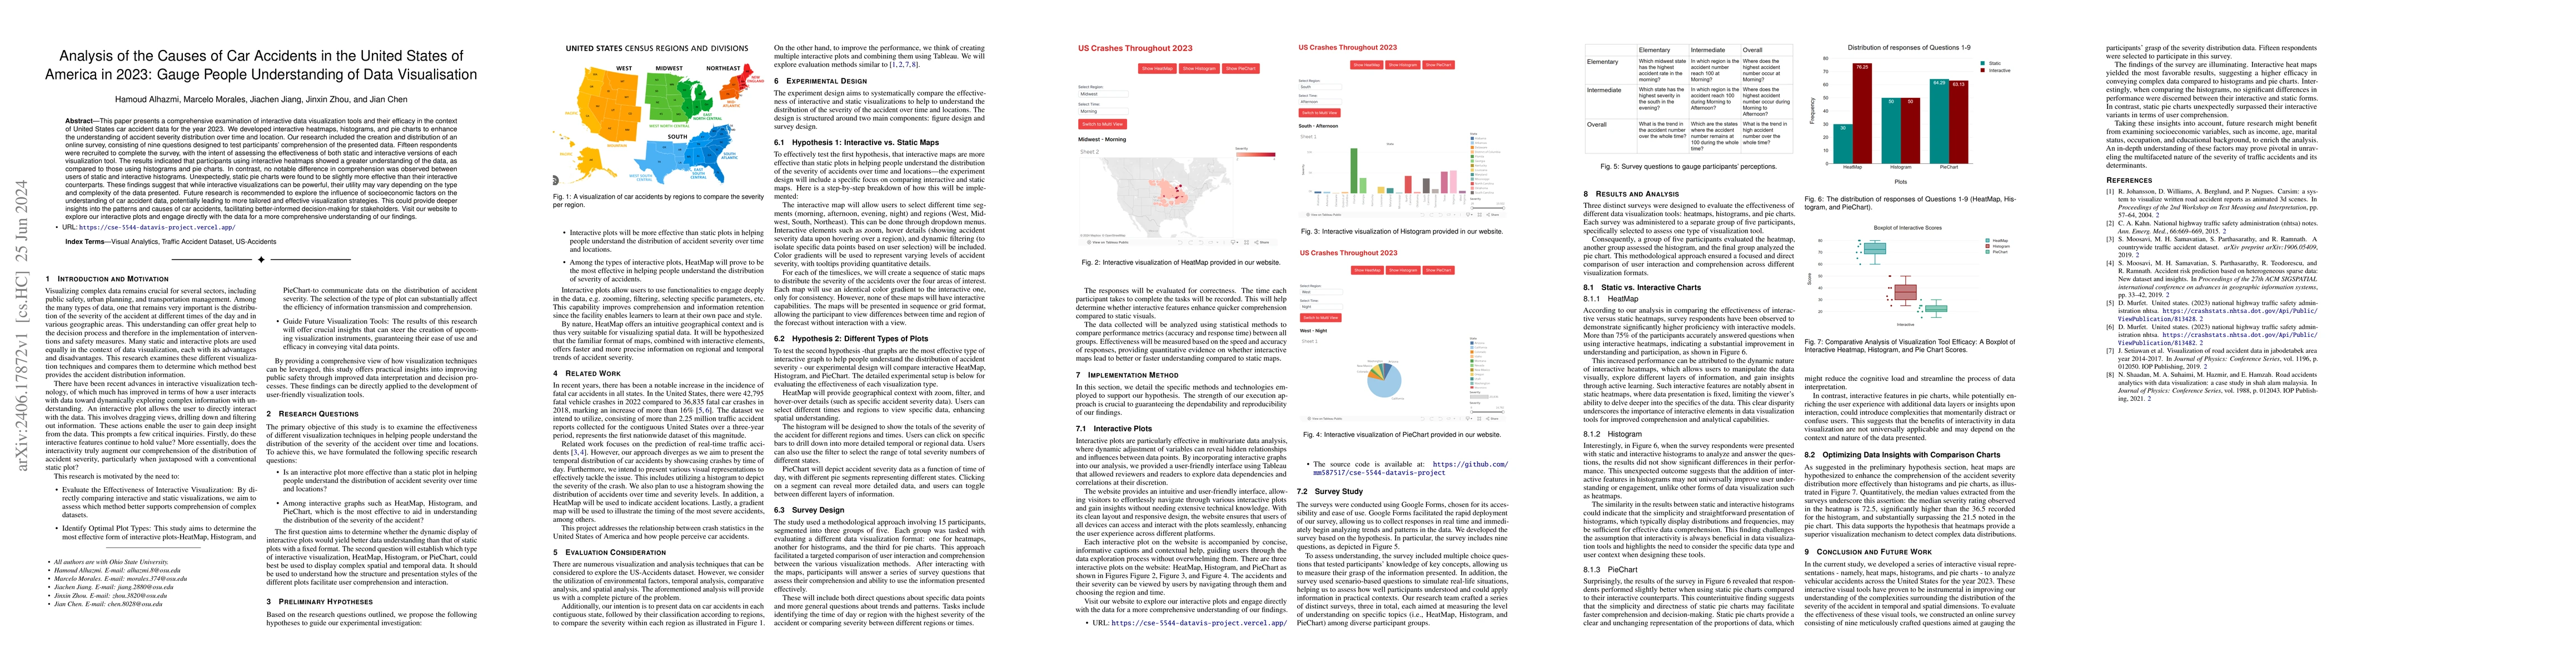
This paper presents a comprehensive examination of interactive data visualization tools and their efficacy in the context of United States car accident data for the year 2023. We developed interactive heatmaps, histograms, and pie charts to enhance the understanding of accident severity distribution over time and location. Our research included the creation and distribution of an online survey, consisting of nine questions designed to test participants comprehension of the presented data. Fifteen respondents were recruited to complete the survey, with the intent of assessing the effectiveness of both static and interactive versions of each visualization tool. The results indicated that participants using interactive heatmaps showed a greater understanding of the data, as compared to those using histograms and pie charts. In contrast, no notable difference in comprehension was observed between users of static and interactive histograms. Unexpectedly, static pie charts were found to be slightly more effective than their interactive counterparts. These findings suggest that while interactive visualizations can be powerful, their utility may vary depending on the type and complexity of the data presented. Future research is recommended to explore the influence of socioeconomic factors on the understanding of car accident data, potentially leading to more tailored and effective visualization strategies. This could provide deeper insights into the patterns and causes of car accidents, facilitating better-informed decision-making for stakeholders. Visit our website to explore our interactive plots and engage directly with the data for a more comprehensive understanding of our findings.
AI Key Findings
Get AI-generated insights about this paper's methodology, results, and significance.
Paper Details
PDF Preview
Key Terms
Citation Network
Current paper (gray), citations (green), references (blue)
Display is limited for performance on very large graphs.
Similar Papers
Found 4 papersProbabilistic modelling of car traffic accidents
Simone Göttlich, Thomas Schillinger, Andrea Tosin
Trends in Rates of Heat-Related Deaths Across Population Groups in the United States, 2000-2023.
Hong, Young-Rock, Dalisay, Francis S, Xie, Zhigang
No citations found for this paper.
Comments (0)