Authors
Summary
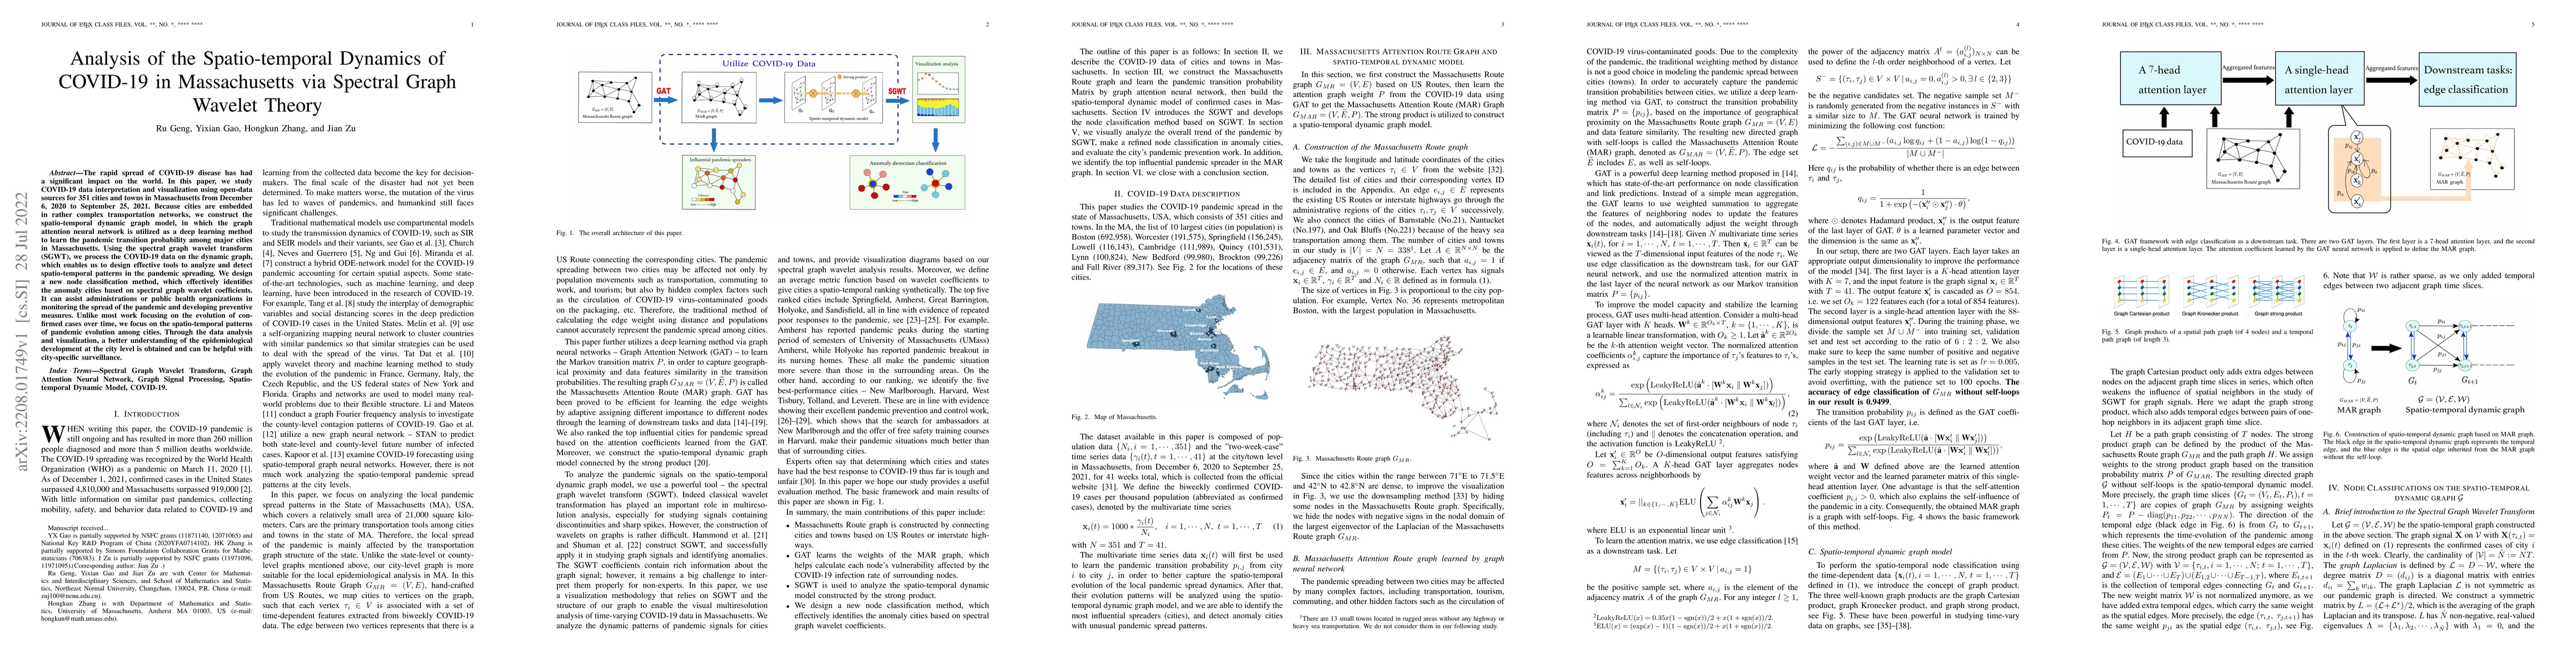
The rapid spread of COVID-19 disease has had a significant impact on the world. In this paper, we study COVID-19 data interpretation and visualization using open-data sources for 351 cities and towns in Massachusetts from December 6, 2020 to September 25, 2021. Because cities are embedded in rather complex transportation networks, we construct the spatio-temporal dynamic graph model, in which the graph attention neural network is utilized as a deep learning method to learn the pandemic transition probability among major cities in Massachusetts. Using the spectral graph wavelet transform (SGWT), we process the COVID-19 data on the dynamic graph, which enables us to design effective tools to analyze and detect spatio-temporal patterns in the pandemic spreading. We design a new node classification method, which effectively identifies the anomaly cities based on spectral graph wavelet coefficients. It can assist administrations or public health organizations in monitoring the spread of the pandemic and developing preventive measures. Unlike most work focusing on the evolution of confirmed cases over time, we focus on the spatio-temporal patterns of pandemic evolution among cities. Through the data analysis and visualization, a better understanding of the epidemiological development at the city level is obtained and can be helpful with city-specific surveillance.
AI Key Findings
Get AI-generated insights about this paper's methodology, results, and significance.
Paper Details
PDF Preview
Key Terms
Citation Network
Current paper (gray), citations (green), references (blue)
Display is limited for performance on very large graphs.
Similar Papers
Found 4 papersSpatio-Temporal meets Wavelet: Disentangled Traffic Flow Forecasting via Efficient Spectral Graph Attention Network
Chenxing Wang, Liang Zeng, Haiyong Luo et al.
| Title | Authors | Year | Actions |
|---|
Comments (0)