Analyzing State-Level Longevity Trends with the U.S. Mortality Database
Publication
Metrics
AI Quick Summary
This paper analyzes state-level age-specific mortality trends using the U.S. Mortality Database, employing Multi-Output Gaussian Process regression to model variations. It reveals significant heterogeneity in mortality across states, highlighting divergent trends between best and worst states, genders, and age groups, offering insights into mortality drivers.
Paper Preview
Abstract
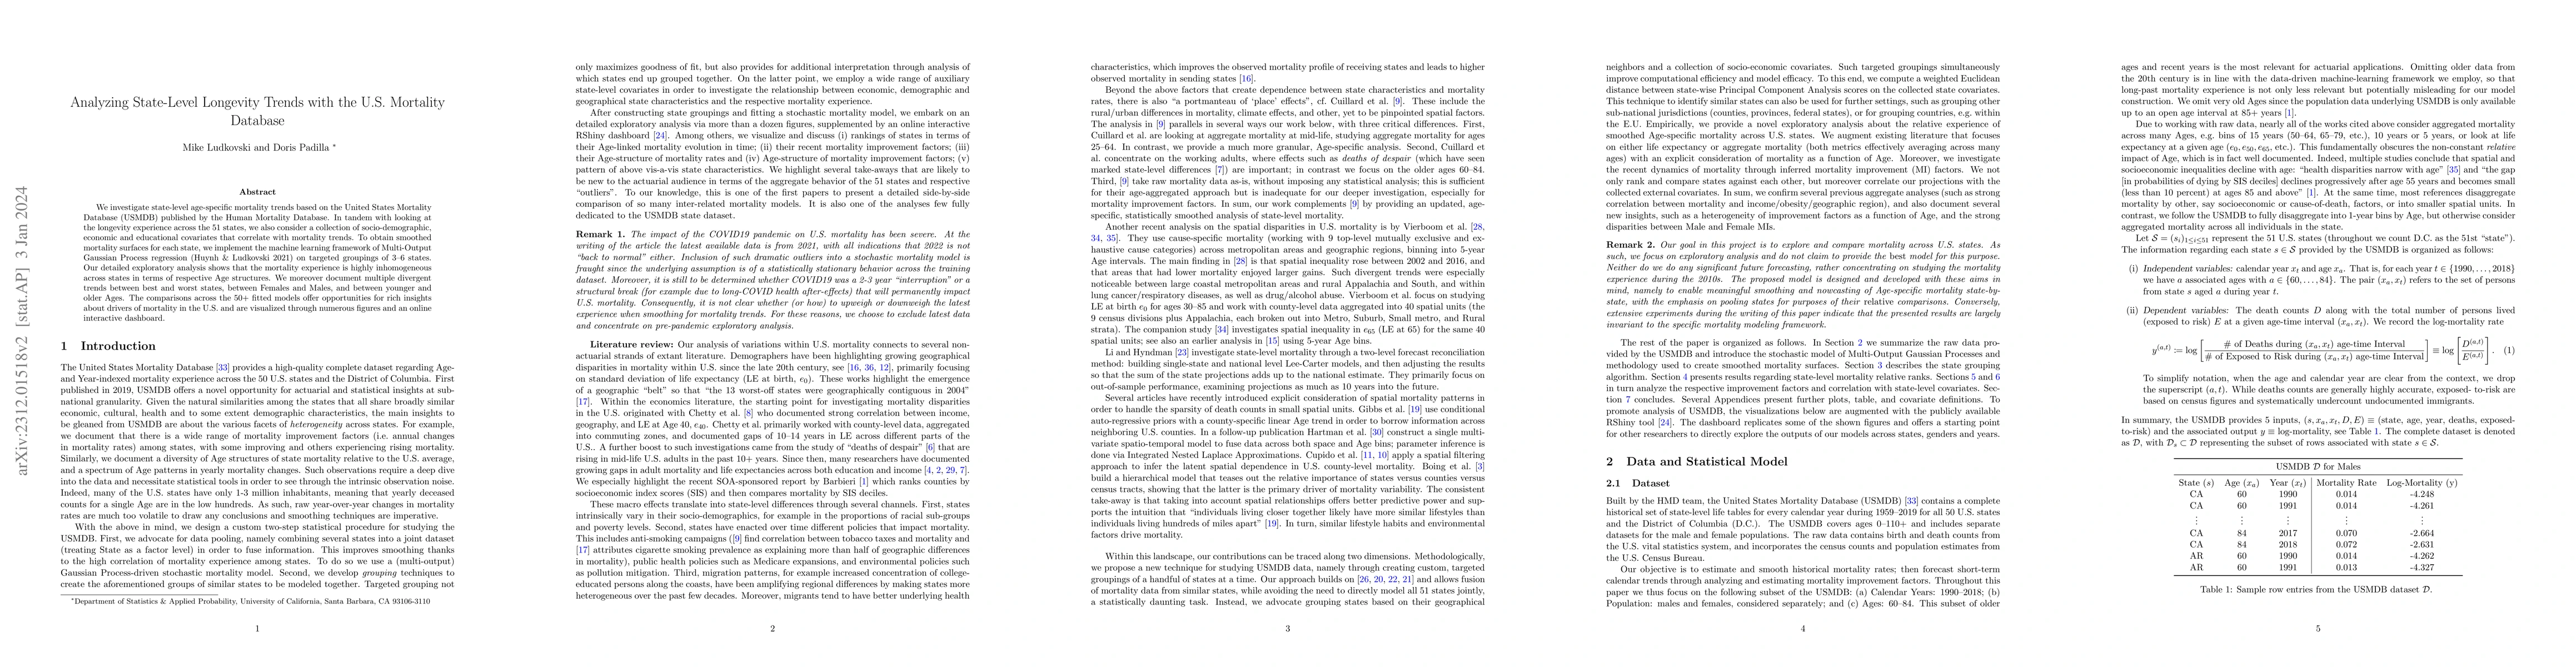
We investigate state-level age-specific mortality trends based on the United States Mortality Database (USMDB) published by the Human Mortality Database. In tandem with looking at the longevity experience across the 51 states, we also consider a collection of socio-demographic, economic and educational covariates that correlate with mortality trends. To obtain smoothed mortality surfaces for each state, we implement the machine learning framework of Multi-Output Gaussian Process regression (Huynh & Ludkovski 2021) on targeted groupings of 3-6 states. Our detailed exploratory analysis shows that the mortality experience is highly inhomogeneous across states in terms of respective Age structures. We moreover document multiple divergent trends between best and worst states, between Females and Males, and between younger and older Ages. The comparisons across the 50+ fitted models offer opportunities for rich insights about drivers of mortality in the U.S. and are visualized through numerous figures and an online interactive dashboard.
AI Key Findings
Get AI-generated insights about this paper's methodology, results, significance, and more — seven facets brought into focus.
Impact
Paper Details
Authors
PDF Preview
Key Terms
Citation Network
Current paper (gray), citations (green), references (blue)
Display is limited for performance on very large graphs.
Discussion 0