Analyzing the Data of COVID-19 with Quasi-Distribution Fitting Based on Piecewise B-spline Curves
Publication
Metrics
AI Quick Summary
This paper introduces a quasi-distribution fitting (QDF) method based on piecewise B-spline curves to analyze COVID-19 data, simulating the distribution histogram of daily confirmed cases. The method reveals declining case fatality rates after multiple waves, demonstrating its effectiveness as an appraisal tool.
Paper Preview
Abstract
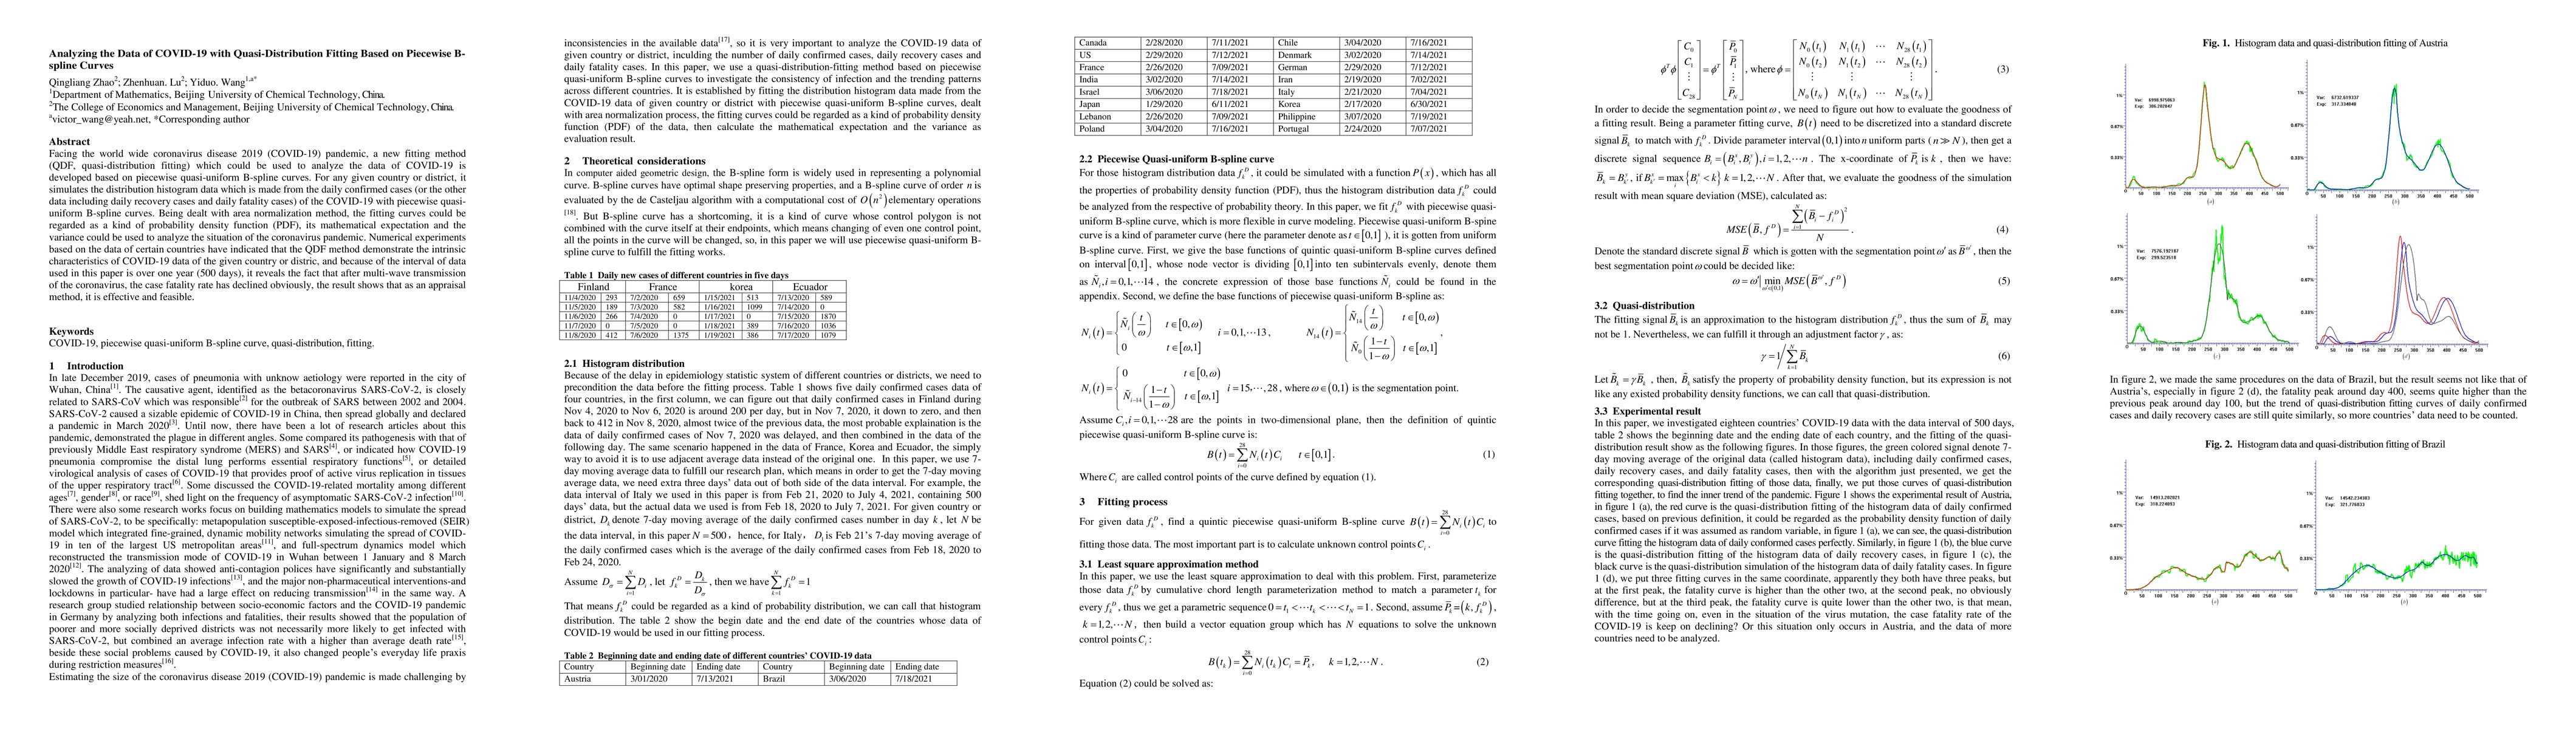
Facing the world wide coronavirus disease 2019 (COVID-19) pandemic, a new fitting method (QDF, quasi-distribution fitting) which could be used to analyze the data of COVID-19 is developed based on piecewise quasi-uniform B-spline curves. For any given country or district, it simulates the distribution histogram data which is made from the daily confirmed cases (or the other data including daily recovery cases and daily fatality cases) of the COVID-19 with piecewise quasi-uniform B-spline curves. Being dealt with area normalization method, the fitting curves could be regarded as a kind of probability density function (PDF), its mathematical expectation and the variance could be used to analyze the situation of the coronavirus pandemic. Numerical experiments based on the data of certain countries have indicated that the QDF method demonstrate the intrinsic characteristics of COVID-19 data of the given country or distric, and because of the interval of data used in this paper is over one year (500 days), it reveals the fact that after multi-wave transmission of the coronavirus, the case fatality rate has declined obviously, the result shows that as an appraisal method, it is effective and feasible.
AI Key Findings
Get AI-generated insights about this paper's methodology, results, significance, and more — seven facets brought into focus.
Impact
Paper Details
Authors
PDF Preview
Key Terms
Citation Network
Current paper (gray), citations (green), references (blue)
Display is limited for performance on very large graphs.
Discussion 0