Analyzing Time Attributes in Temporal Event Sequences
Publication
Metrics
AI Quick Summary
The methodology has been applied to a real-world dataset and yields meaningful conclusions about waiting times and patient flow analysis, improving our understanding of complex temporal data.
Paper Preview
Abstract
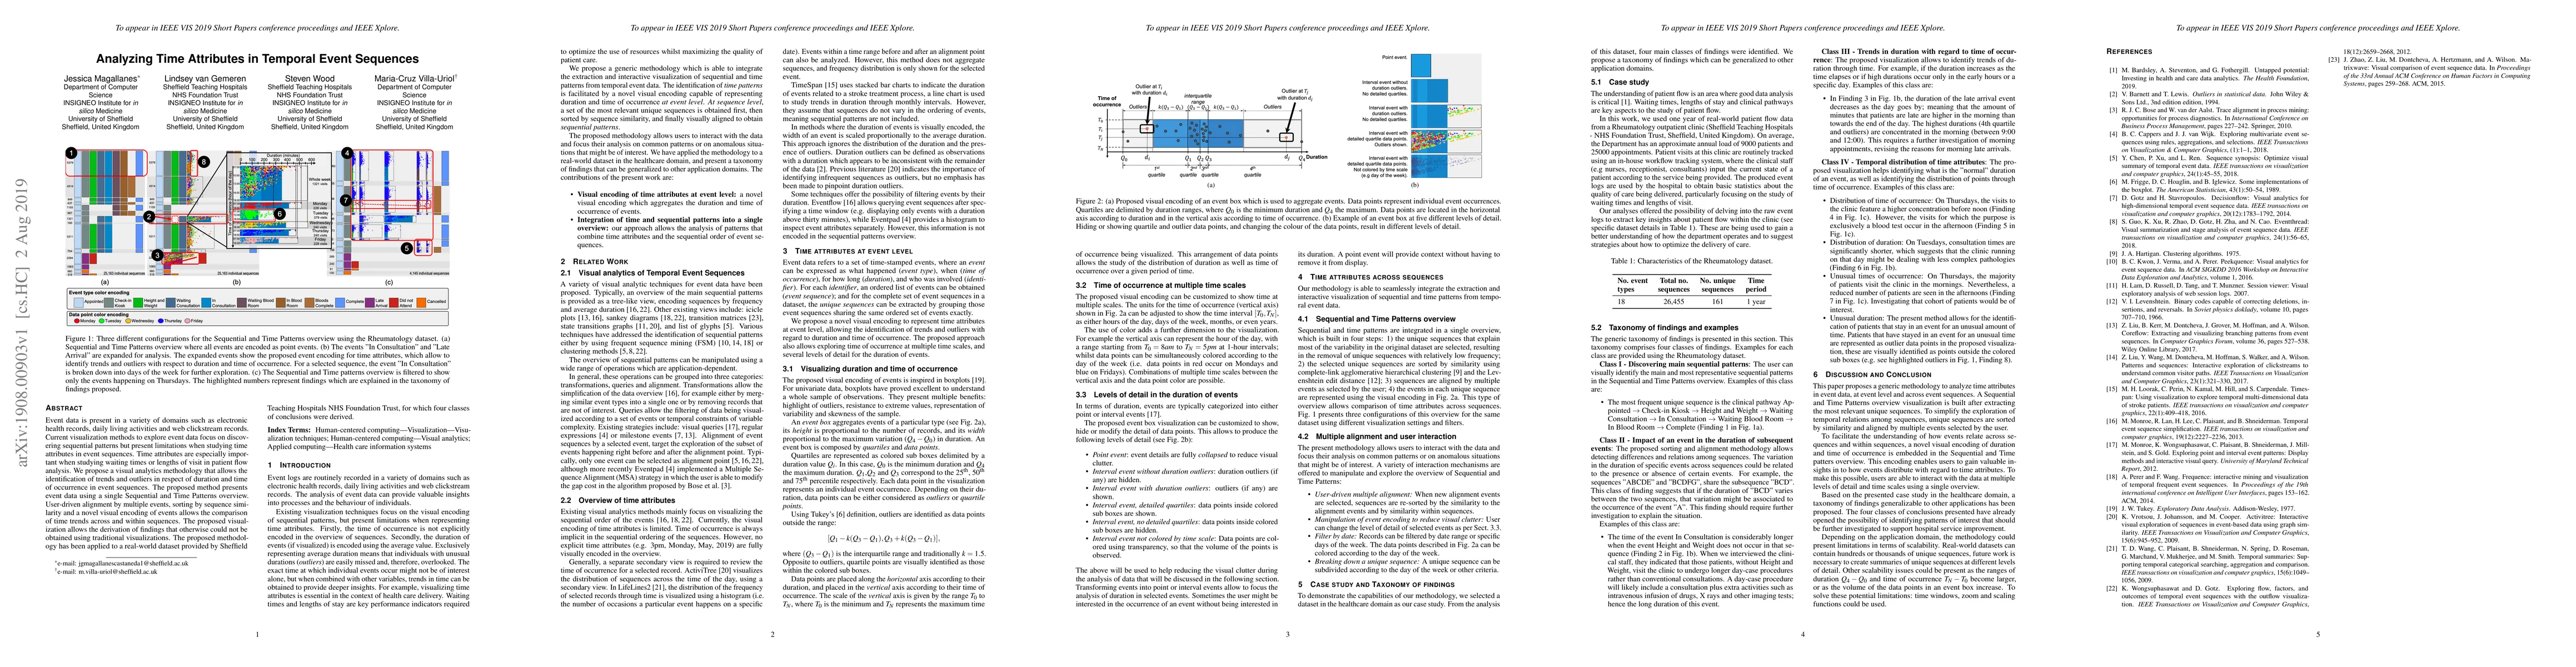
Event data is present in a variety of domains such as electronic health records, daily living activities and web clickstream records. Current visualization methods to explore event data focus on discovering sequential patterns but present limitations when studying time attributes in event sequences. Time attributes are especially important when studying waiting times or lengths of visit in patient flow analysis. We propose a visual analytics methodology that allows the identification of trends and outliers in respect of duration and time of occurrence in event sequences. The proposed method presents event data using a single Sequential and Time Patterns overview. User-driven alignment by multiple events, sorting by sequence similarity and a novel visual encoding of events allows the comparison of time trends across and within sequences. The proposed visualization allows the derivation of findings that otherwise could not be obtained using traditional visualizations. The proposed methodology has been applied to a real-world dataset provided by Sheffield Teaching Hospitals NHS Foundation Trust, for which four classes of conclusions were derived.
AI Key Findings
Get AI-generated insights about this paper's methodology, results, significance, and more — seven facets brought into focus.
Impact
Paper Details
PDF Preview
Key Terms
Citation Network
Current paper (gray), citations (green), references (blue)
Display is limited for performance on very large graphs.
Discussion 0