Authors
Summary
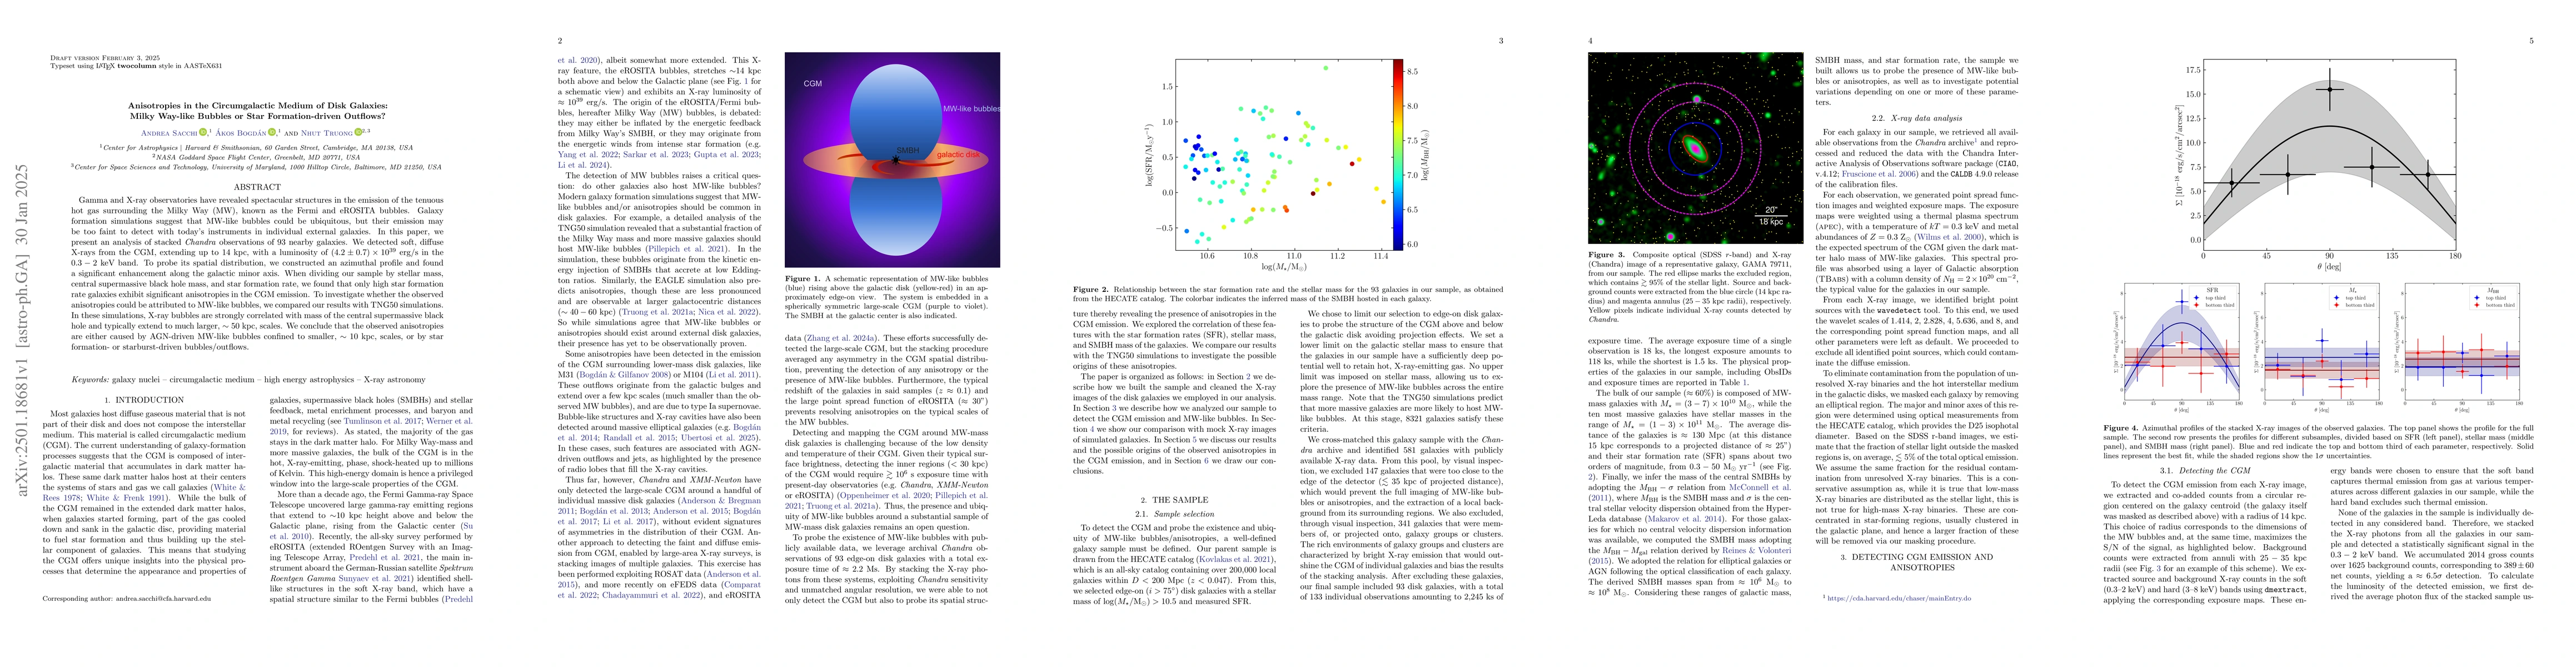
Gamma and X-ray observatories have revealed spectacular structures in the emission of the tenuous hot gas surrounding the Milky Way (MW), known as the Fermi and eROSITA bubbles. Galaxy formation simulations suggest that MW-like bubbles could be ubiquitous, but their emission may be too faint to detect with today's instruments in individual external galaxies. In this paper, we present an analysis of stacked Chandra observations of 93 nearby galaxies. We detected soft, diffuse X-rays from the CGM, extending up to 14 kpc, with a luminosity of $(4.2\pm0.7)\times10^{39}$ erg/s in the $0.3-2$ keV band. To probe its spatial distribution, we constructed an azimuthal profile and found a significant enhancement along the galactic minor axis. When dividing our sample by stellar mass, central supermassive black hole mass, and star formation rate, we found that only high star formation rate galaxies exhibit significant anisotropies in the CGM emission. To investigate whether the observed anisotropies could be attributed to MW-like bubbles, we compared our results with TNG50 simulations. In these simulations, X-ray bubbles are strongly correlated with mass of the central supermassive black hole and typically extend to much larger, $\sim50$ kpc, scales. We conclude that the observed anisotropies are either caused by AGN-driven MW-like bubbles confined to smaller, $\sim10$ kpc, scales, or by star formation- or starburst-driven bubbles/outflows.
AI Key Findings
Get AI-generated insights about this paper's methodology, results, and significance.
Paper Details
PDF Preview
Citation Network
Current paper (gray), citations (green), references (blue)
Display is limited for performance on very large graphs.
Similar Papers
Found 4 papersThe Circumgalactic Medium of Milky Way-like Galaxies in the TNG50 Simulation -- I: Halo Gas Properties and the Role of SMBH Feedback
Rahul Ramesh, Dylan Nelson, Annalisa Pillepich
No citations found for this paper.
Comments (0)