Applicability of Hubbert model to global mining industry: Interpretations and insights
Publication
Metrics
AI Quick Summary
This paper introduces and assesses Hubbert's model, originally for oil production, to evaluate its applicability to global mining industry trends. It proposes a "Hubbert's map" for visualizing the model's conclusions on resource depletion and its robustness as a foresight tool.
Paper Preview
Abstract
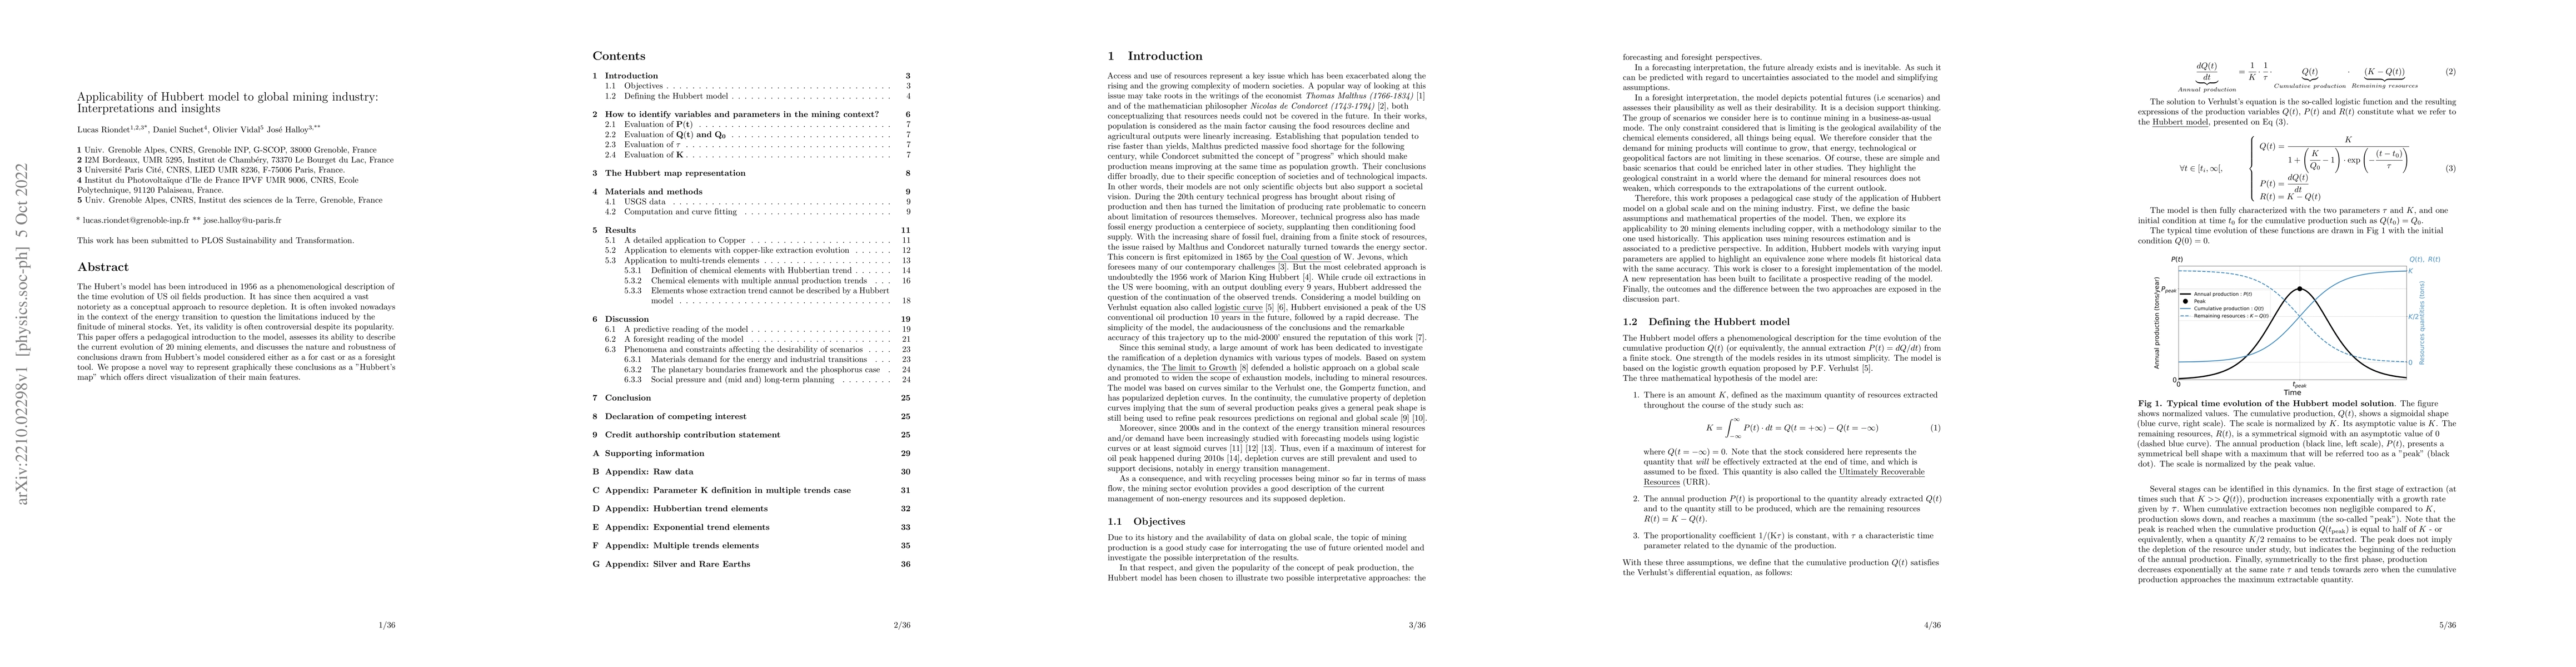
The Hubert's model has been introduced in 1956 as a phenomenological description of the time evolution of US oil fields production. It has since then acquired a vast notoriety as a conceptual approach to resource depletion. It is often invoked nowadays in the context of the energy transition to question the limitations induced by the finitude of mineral stocks. Yet, its validity is often controversial despite its popularity. This paper offers a pedagogical introduction to the model, assesses its ability to describe the current evolution of 20 mining elements, and discusses the nature and robustness of conclusions drawn from Hubbert's model considered either as a for cast or as a foresight tool. We propose a novel way to represent graphically these conclusions as a "Hubbert's map" which offers direct visualization of their main features.
AI Key Findings
Get AI-generated insights about this paper's methodology, results, significance, and more — seven facets brought into focus.
Impact
Paper Details
Authors
PDF Preview
Key Terms
Citation Network
Current paper (gray), citations (green), references (blue)
Display is limited for performance on very large graphs.
Discussion 0