Application of convolutional neural networks for data analysis in TAIGA-HiSCORE experiment
Publication
Metrics
AI Quick Summary
This paper explores the application of convolutional neural networks (CNNs) to analyze data from the TAIGA-HiSCORE experiment, which detects Cherenkov radiation to reconstruct air shower characteristics. The study demonstrates that CNNs can achieve accuracy comparable to traditional methods in determining shower energy and direction.
Paper Preview
Abstract
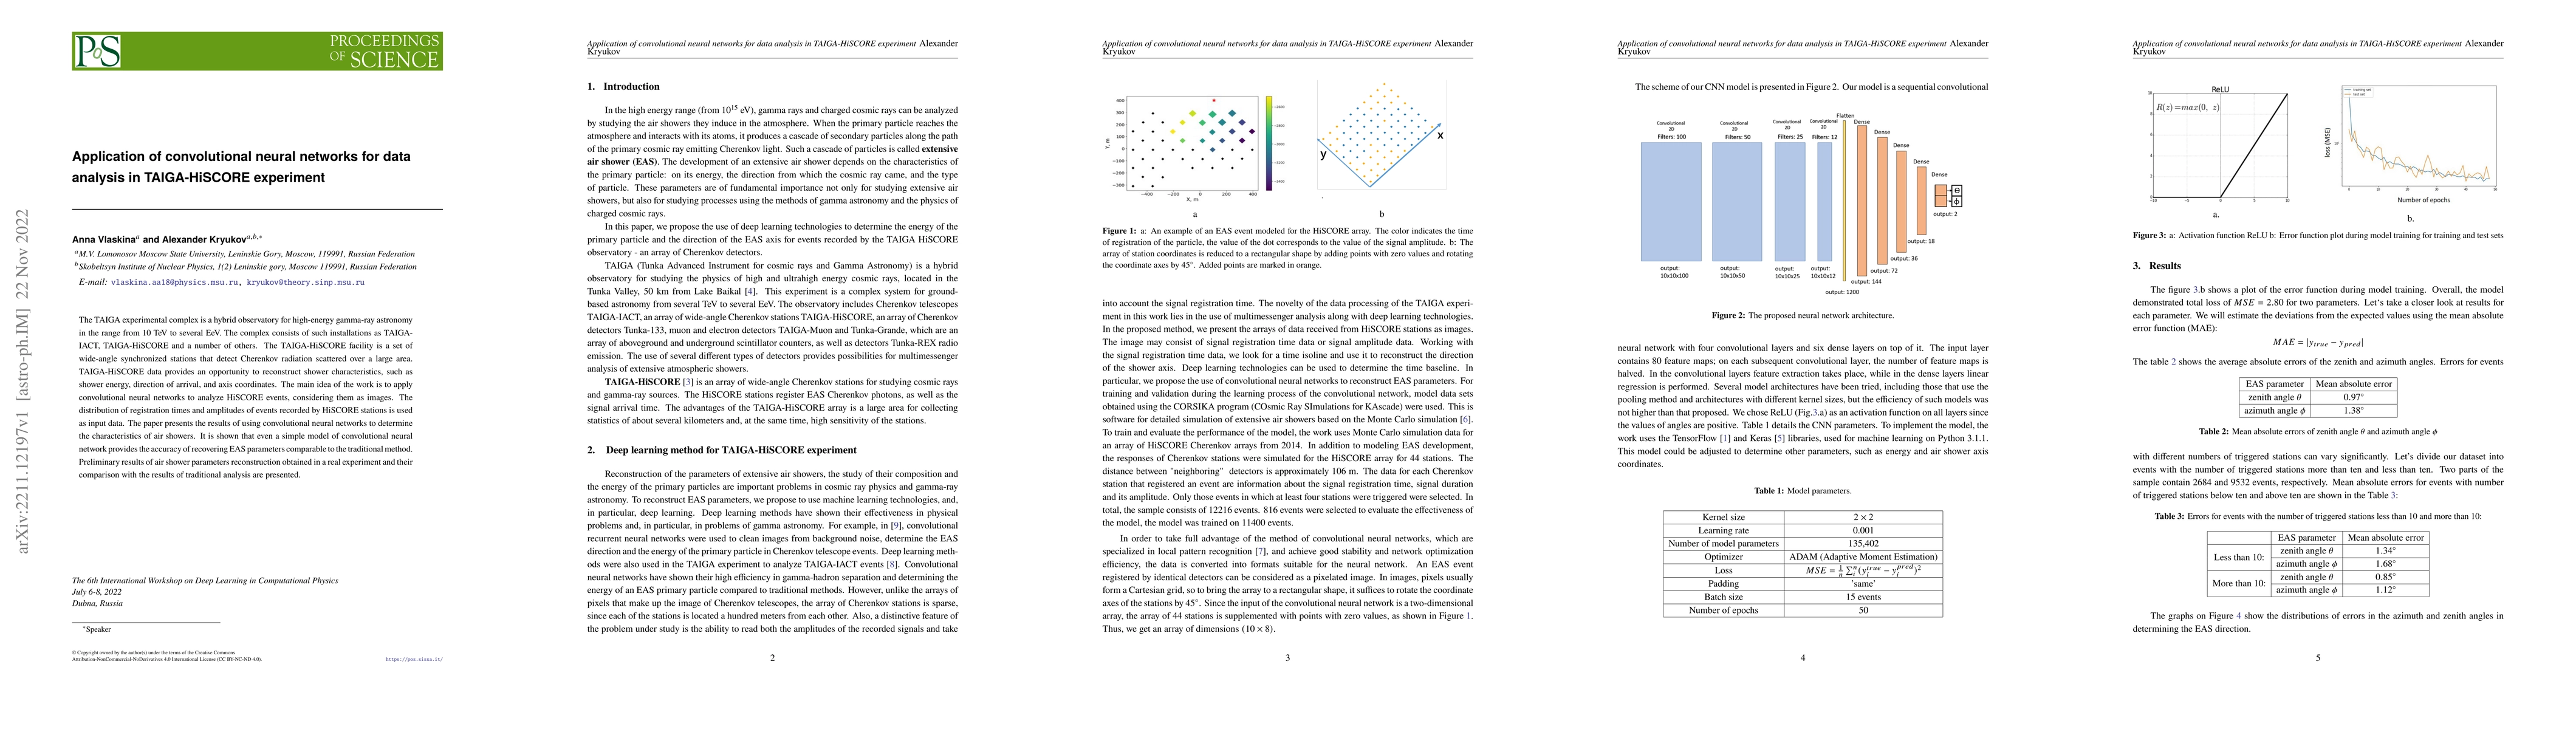
The TAIGA experimental complex is a hybrid observatory for high-energy gamma-ray astronomy in the range from 10 TeV to several EeV. The complex consists of such installations as TAIGA- IACT, TAIGA-HiSCORE and a number of others. The TAIGA-HiSCORE facility is a set of wide-angle synchronized stations that detect Cherenkov radiation scattered over a large area. TAIGA-HiSCORE data provides an opportunity to reconstruct shower characteristics, such as shower energy, direction of arrival, and axis coordinates. The main idea of the work is to apply convolutional neural networks to analyze HiSCORE events, considering them as images. The distribution of registration times and amplitudes of events recorded by HiSCORE stations is used as input data. The paper presents the results of using convolutional neural networks to determine the characteristics of air showers. It is shown that even a simple model of convolutional neural network provides the accuracy of recovering EAS parameters comparable to the traditional method. Preliminary results of air shower parameters reconstruction obtained in a real experiment and their comparison with the results of traditional analysis are presented.
AI Key Findings
Get AI-generated insights about this paper's methodology, results, significance, and more — seven facets brought into focus.
Impact
Paper Details
Authors
PDF Preview
Key Terms
Citation Network
Current paper (gray), citations (green), references (blue)
Display is limited for performance on very large graphs.
Discussion 0