Summary
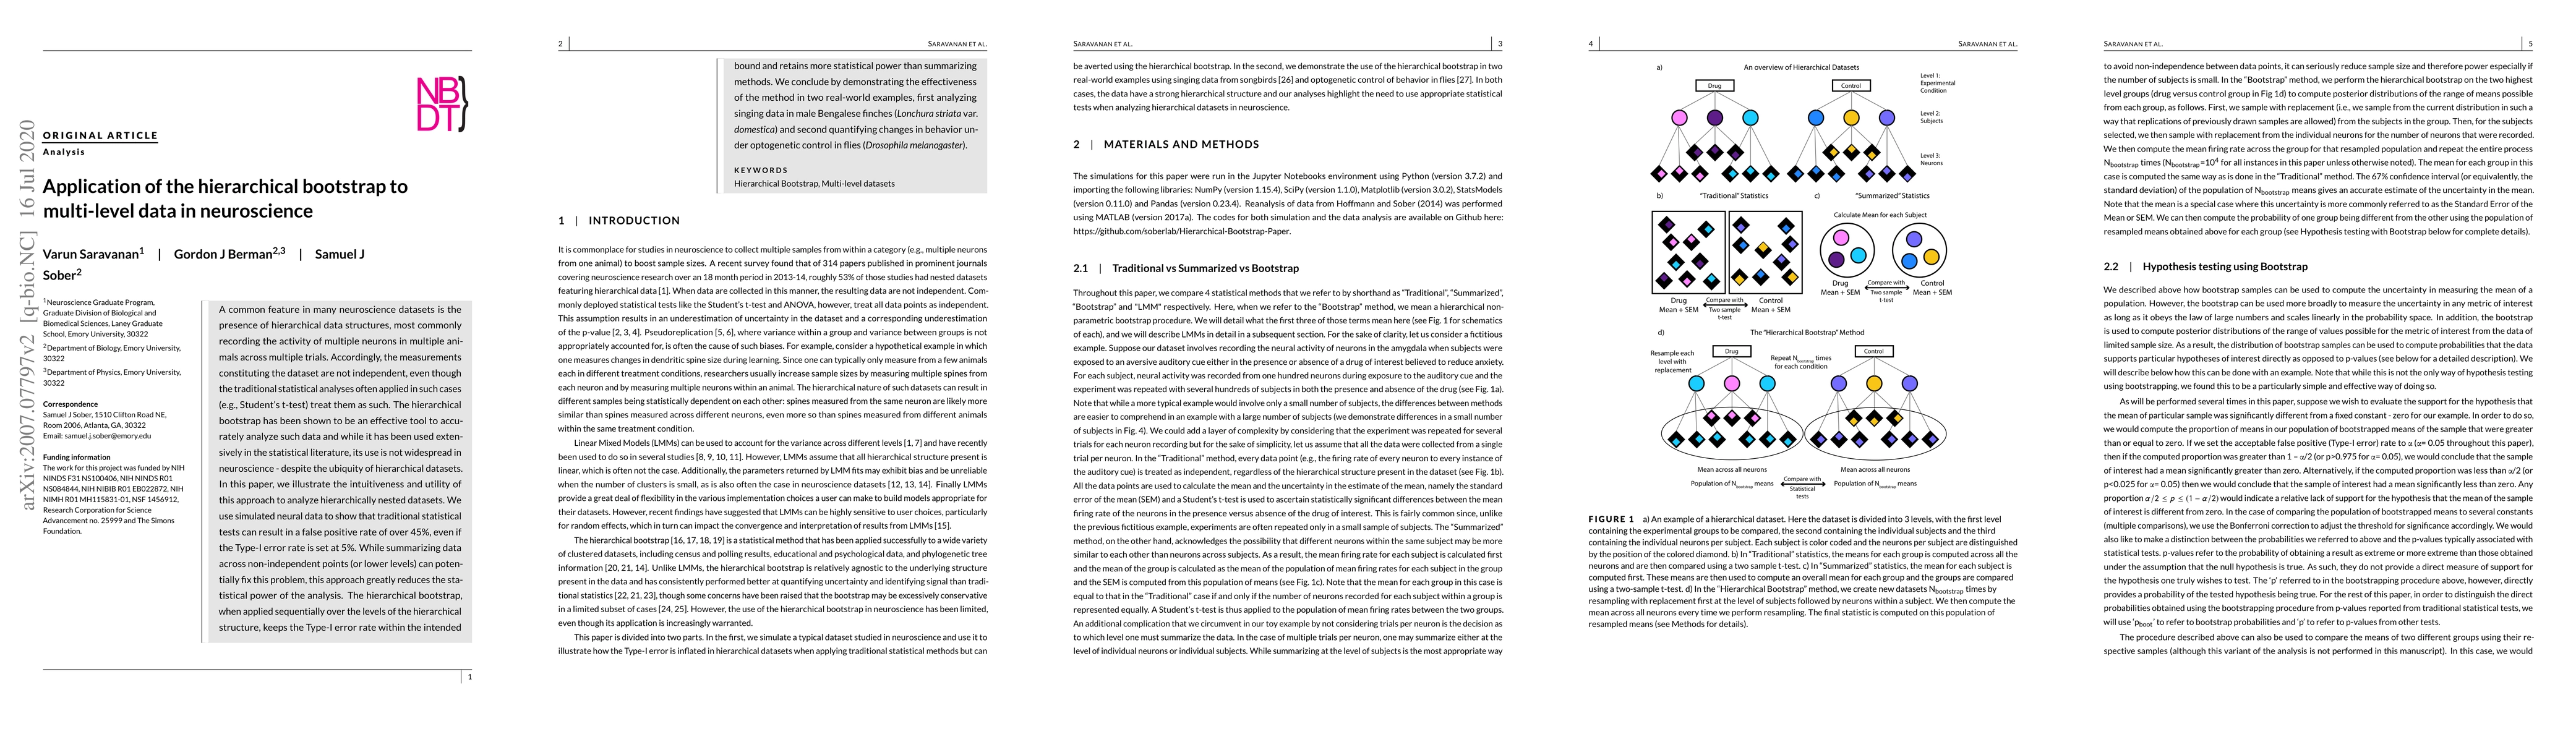
A common feature in many neuroscience datasets is the presence of hierarchical data structures, most commonly recording the activity of multiple neurons in multiple animals across multiple trials. Accordingly, the measurements constituting the dataset are not independent, even though the traditional statistical analyses often applied in such cases (e.g., Students t-test) treat them as such. The hierarchical bootstrap has been shown to be an effective tool to accurately analyze such data and while it has been used extensively in the statistical literature, its use is not widespread in neuroscience - despite the ubiquity of hierarchical datasets. In this paper, we illustrate the intuitiveness and utility of this approach to analyze hierarchically nested datasets. We use simulated neural data to show that traditional statistical tests can result in a false positive rate of over 45%, even if the Type-I error rate is set at 5%. While summarizing data across non-independent points (or lower levels) can potentially fix this problem, this approach greatly reduces the statistical power of the analysis. The hierarchical bootstrap, when applied sequentially over the levels of the hierarchical structure, keeps the Type-I error rate within the intended bound and retains more statistical power than summarizing methods. We conclude by demonstrating the effectiveness of the method in two real-world examples, first analyzing singing data in male Bengalese finches (Lonchura striata var. domestica) and second quantifying changes in behavior under optogenetic control in flies (Drosophila melanogaster).
AI Key Findings
Get AI-generated insights about this paper's methodology, results, and significance.
Paper Details
PDF Preview
Key Terms
Citation Network
Current paper (gray), citations (green), references (blue)
Display is limited for performance on very large graphs.
Similar Papers
Found 4 papersHierarchical Robust PCA for Scalable Data Quality Monitoring in Multi-level Aggregation Pipelines
Preetam Kumar Ojha
Analyzing hierarchical multi-view MRI data with StaPLR: An application to Alzheimer's disease classification
Botond Szabo, Mark de Rooij, Reinhold Schmidt et al.
| Title | Authors | Year | Actions |
|---|
Comments (0)