Executive Summary
Case-Based Reasoning (CBR) operates by solving new problems by reusing solutions from a library of past cases. Yet, quantifying how well a CBR system performs, especially when outcomes are uncertain or graded (negligible to complete), remains challenging. The article tackles this gap by importing fuzzy-logic ideas to both formalize the CBR process and provide quantitative measures of system effectiveness. The central contribution is the development and deployment of two complementary fuzzy-modeling approaches that translate stepwise success into numeric performance indicators, enabling comparisons across CBR systems and guiding design choices.
The first approach, attributed to Voskoglou, models a CBR system with three steps—retrieval, reuse, and revision—each evaluated with linguistic labels (negligible, low, intermediate, high, complete). Past cases are tallied by label, forming fuzzy sets over the state space of R1, R2, and R3. A fuzzy relation captures all possible three-step profiles, and a profile’s membership degree reflects how well it represents the library’s experience. The overall system efficiency is then measured by the total possibilistic uncertainty, T(r), of the ordered profile distribution. A smaller T(r) signals greater information gain and, hence, better performance. The paper demonstrates this on example libraries, showing that a second library (with a different size) can be more efficient even when the first appears stronger under other criteria.
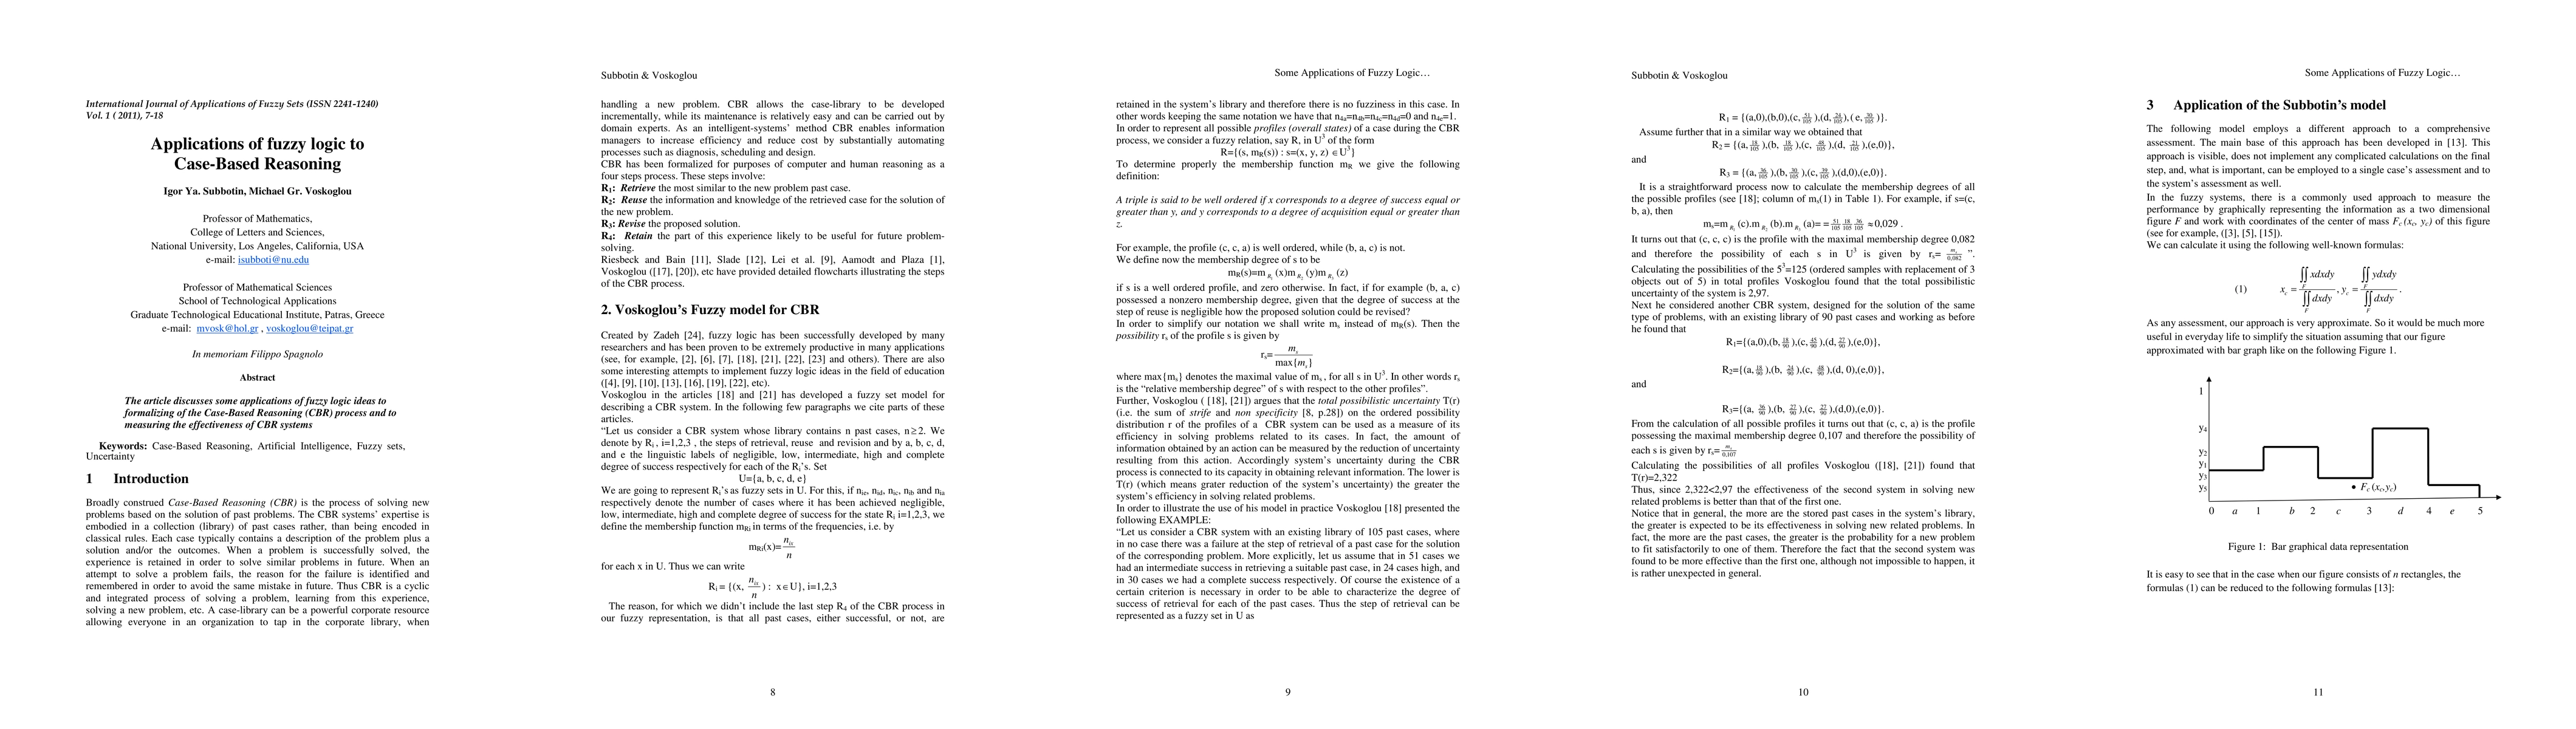
The second approach, due to Subbotin, adopts a center-of-mass (CoM) perspective on a bar-graph representation of how frequently each linguistic label appears at each step. By mapping the five labels to numeric coordinates and computing a center of mass (xc, yc), the authors establish a simple decision rule: larger xc is better; if xc ties, the larger yc wins; if those tie, the smaller yc wins. This yields a direct, visually interpretable comparison of performance profiles across libraries and steps.
Taken together, the two models offer a nuanced, quantitative toolkit for evaluating CBR systems that goes beyond qualitative judgments or single-threshold accuracy. The main takeaway is that a combined use of the two approaches provides complementary insights: the possibilistic-uncertainty metric emphasizes information-theoretic efficiency, while the CoM-based metric foregrounds the overall quality and distribution of outcomes. For practitioners, this supports more informed decisions about library design, system tuning, and which CBR strategy to deploy in a given domain.
Background\n\nCase-Based Reasoning (CBR) is a problem-solving paradigm where new problems are attacked by reusing solutions from similar past cases. The strength of CBR lies in its case library, which encodes experience rather than a fixed rule base. To assess CBR systems, especially under uncertainty about success levels, fuzzy-logic concepts can be leveraged to model partial successes and to quantify system performance. The article builds on Voskoglou’s fuzzy-set formalization of CBR and introduces Subbotin’s center-of-mass (CoM) approach as an additional evaluation lens.\n\nProblem / Research Question\n\nHow can fuzzy logic be used to (i) represent the uncertain, graded success of CBR steps and (ii) compare different CBR systems (e.g., libraries of past cases) in a principled, quantitative way? The paper asks whether fuzzy representations of stepwise performance and uncertainty measures can reveal differences that single-number accuracy metrics miss, and whether combining two distinct analytic lenses yields a more robust assessment.\n\nInnovation / Contribution\n\nThe paper makes two key contributions. First, it adopts a fuzzy-set model for CBR where the three core steps—Retrieval (R1), Reuse (R2), and Revision (R3)—are evaluated with five linguistic labels (negligible, low, intermediate, high, complete). It defines the frequency counts for each label, constructs fuzzy sets for each step, and forms a fuzzy relation over U3 to capture all three-step profiles. The outcome is a relative membership degree rs for each profile, and a global efficiency measure T(r) = total possibilistic uncertainty of the ordered profile distribution. Second, it presents Subbotin’s CoM-based approach. Here the distribution of outcomes is encoded as a bar-graph with five labels mapped to coordinates, and the system’s performance is summarized by the center of mass (xc, yc). A simple decision rule compares xc first, then yc if needed. Both methods are illustrated with concrete numbers, enabling direct cross-library comparisons.\n\nMethodology / Approach\n\nVoskoglou’s model: 1) For a library with n past cases, count for each Ri (i=1,2,3) how many cases achieve each label a,b,c,d,e (negligible to complete). 2) Represent Ri as a fuzzy set over the label set U = {a,b,c,d,e} using frequencies niα. 3) Define the set of all 3-step profiles s ∈ U3 and compute the membership ms(s) for each s, with a profile only contributing if it is well-ordered (nonincreasing degrees of success across steps). 4) The “possibility” rs of a profile s is ms(s) divided by the maximum ms over all s. 5) The system’s overall uncertainty T(r) is computed from the ordered distribution r = . Subbotin’s model: 1) Map counts of labels at each step to a bar-graph with five segments, assign numerical coordinates to the labels (a=0 to e=4, per their scheme), and compute the center of mass (xc, yc) of the resulting figure. 2) The ideal case has all mass on e (complete), yielding Fi; the worst case mass on a only yields Fw. 3) Compare groups by xc first, then yc, following a fixed rule.\n\nExperiments / Evaluation\n\nThe authors illustrate both models with concrete, though stylized, experiments. In Voskoglou’s example, one CBR system has 105 past cases with retrieval outcomes distributed as 51 intermediate (c), 24 high (d), and 30 complete (e); no negligible or low results occur for retrieval. The analysis yields a profile-wise ms(s) and identifies (c,c,c) as the profile with maximal membership 0.082, leading to rs values for all 125 possible profiles. The total possibilistic uncertainty is T(r) = 2.97 for this system. A second system, with 90 past cases and similar patterning, yields maximal-profile membership 0.107 and T(r) = 2.322, hence the second system is better by Voskoglou’s metric (lower uncertainty). Subbotin’s CoM-based comparisons are described for the two groups and steps, showing that in their illustrated experiment the first group excels in several steps and, overall, appears better according to Subbotin’s weighted-average criterion, though the two models can disagree depending on what aspect of performance is emphasized.\n\nKey Results\n\n- Voskoglou’s total possibilistic uncertainty T(r) can distinguish libraries by how much uncertainty remains after observing the profiles; smaller T(r) indicates greater information gain and superior performance in solving related problems. In the provided examples, the library with 90 cases outperforms the one with 105 cases under this metric.\n- Subbotin’s center-of-mass approach highlights the qualitative quality of performance profiles via xc and yc coordinates; the ideal and worst cases define a region of opinion about best practices. In the discussed examples, Subbotin’s analysis may favor the first group in some steps and the second in others, illustrating differences in what the metrics prioritize.\n- The paper argues that combining both models yields a fuller picture of performance, reflecting both average quality and information-efficiency aspects.\n\nPractical Applications\n\nFor researchers and system builders, these models offer a principled way to compare CBR systems beyond conventional accuracy metrics. The fuzzy framework accommodates uncertain, graded outcomes and supports decisions about library size, task domain, and which CBR approach to deploy. The center-of-mass view provides an intuitive visualization, while the possibilistic-uncertainty view grounds comparisons in information-theoretic terms. The authors advocate using both models in tandem to identify an “ideal” performance profile aligned with user goals.\n\nLimitations & Considerations\n\nThe authors acknowledge that the two models capture different notions of performance: uncertainty reduction versus weighted-average quality. This can lead to boundary cases where conclusions diverge. The approach relies on subjective labeling of outcomes, discretization into five categories, and the assumption that R4 is effectively non-fuzzy since all past cases are retained. The methodology is demonstrated on small, stylized experiments; scaling to large, multi-domain CBR systems, incorporating R4 explicitly, and validating against real-world benchmarks remain open challenges. Finally, the sensitivity of results to the chosen five-label scale, frequency-based membership assignments, and the specifics of the center-of-mass mapping warrants systematic study.
Case-Based Reasoning (CBR) solves new problems by reusing solutions from past cases; the paper adds fuzzy-logic ideas to handle uncertainty in judging how well each step of CBR performed for past cases. Each past case is represented by a profile across three steps—retrieval (R1), reuse (R2), and revision (R3)—with qualitative degrees of success mapped to labels from negligible to complete. The three-step outcomes are encoded with fuzzy sets, and the collection of past cases forms a fuzzy data set that can be analyzed with membership degrees. A fuzzy relation over profiles (triples of step-outcomes) yields a membership for each profile, and a derived quantity ms captures how well a particular profile fits the data; rs then normalizes these to compare different profiles.
The paper presents two complementary models for judging CBR performance. Voskoglou's model uses the distribution of profiles across the five qualitative outcomes to compute the total possibilistic uncertainty T(r). This uncertainty measure is interpreted as the amount of information gained (or reduced) by actions within the CBR process; a lower T(r) means greater efficiency in solving related problems. The authors illustrate that larger libraries tend to increase effectiveness, because a new problem is more likely to match an existing past case.
Subbotin's model offers an alternative scalar summary that centers on a center-of-mass calculation of a bar-graph representation of performance. It places emphasis on the quality of performance (how close the system gets to an ideal case) by weighting near-ideal outcomes more heavily in a weighted-average-like calculation. Importantly, the authors show that the two models can disagree on boundary cases, underscoring the value of using both to obtain a nuanced assessment. Together, these fuzzy-logic approaches convert qualitative judgments about CBR performance into quantitative metrics, enabling meaningful comparisons and better decisions about which CBR system to deploy in a given context.
Explain It Like I'm 14
Imagine you have a big toolbox of solved problems from math class. When a new problem comes, you try to pick a toolbox solution that fits best, then you tweak it a bit and decide if you should save that tweak for next time. The researchers want to measure how good this whole “learn from the past and improve” game is, but not with a single simple number. Instead, they use two smart ways to judge: one looks at how clear the improvements are (uncertainty) and another looks at where the group of results sits on a map (center of mass).
First idea (the fuzzy map of success): For each step in solving a new problem—getting a similar past case ( Retrieval ), using that case ( Reuse ), and fine-tuning the solution ( Revision )—the outcomes aren’t just yes or no. They can be negligible, low, middle, high, or complete. They count how many past problems land in each category, and then they pretend these counts are fuzzy pictures of how well the system did at each step. They look at all the possible combinations of three-step outcomes and ask: which combinations occur the most? They then measure how much uncertainty remains after looking at all this. If there’s less uncertainty, the system is doing a better job at solving new problems using past cases.
Second idea (the center-of-m mass idea): They also turn the results into a simple bar chart, where each color (or label) is assigned a number. You can imagine a scale from 0 to 4. They then find the “center of mass” of that bar chart, which is like finding the balance point. If that balance point is further to the right, it means more high-quality outcomes happened. They compare two toolboxes by where this balance point lands; bigger x means better, and if two toolboxes balance at the same x, they look at the y coordinate to break ties.
What they found is that these two ways of measuring don’t always agree. One library might look better when judged by the balance point, while another looks better when judged by lower remaining uncertainty. The important part is that using both together gives a fuller picture of how good a CBR system is. This can help teachers and builders decide which set of past cases to trust and how to tune the system so it learns from its own mistakes.
Center of mass: A two-dimensional measure used to summarize a fuzzy distribution or figure — "center of mass Fc (xc, yc) of this figure"
Fuzzy logic: Created by Zadeh [24], fuzzy logic has been successfully developed
Fuzzy relation: a relation used to describe all possible profiles (overall states) of a case in the fuzzy CBR model — "a fuzzy relation, say R, in U 3 of the form"
Fuzzy set: A mathematical framework for representing uncertain knowledge; used for the CBR model — "fuzzy set model for describing a CBR system"
Linguistic labels: Qualitative categories (negligible, low, intermediate, high, complete) assigned to step outcomes — "linguistic labels of negligible, low, intermediate, high and complete degree of success respectively for each of the Ri's."
Membership degree: The degree to which a profile member belongs to the fuzzy set, denoted ms — "The membership degree of s to be ms"
Membership function: Function mRi that assigns a degree of membership to outcomes based on case frequencies — "membership function mRi in terms of the frequencies, i.e. by"
Past cases library: The repository of prior cases forming the CBR library; more cases tend to improve coverage — "Let us consider a CBR system whose library contains n past cases, n ≥ 2."
Possibility distribution: The ordered distribution over profiles used to quantify uncertainty in CBR performance — "the ordered possibility distribution r of the profiles of a CBR system"
Profile: The triple (R1, R2, R3) describing a case's progression through retrieval, reuse, and revision — "To represent all possible profiles (overall states) of a case during the CBR process, we consider a fuzzy relation, say R, in U 3 of the form"
Relative membership degree: The normalized measure rs indicating a profile's relative prominence among all profiles — "the possibility rs of the profile s is given by"
R1, R2, R3 steps: The steps Retrieve, Reuse, and Revise in CBR; each with a success label (a–e) for each step — "R1: Retrieve the most similar to the new problem past case."
R4: Retain: The Retain step; retaining useful experience for future problem solving — "R4: Retain the part of this experience likely to be useful for future problemsolving."
Subbotin's model: A performance assessment emphasizing weighted averages toward an ideal case, contrasting with Voskoglou's uncertainty-based approach — "the weighted average plays the main role, i.e. the result of the performance close to the ideal performance have much more weight than the one close to the lower end"
Total possibilistic uncertainty: T(r), sum of strife and non-specificity, used as a measure of learning-system efficiency — "total possibilistic uncertainty T(r) (i.e. the sum of strife and non specificity [8, p.28]) on the ordered possibility distribution r of the profiles of a CBR system can be used as a measure of its efficiency in solving problems."
Two-dimensional figure: A graphical representation of performance from which center-of-mass coordinates are computed — "graphically representing the information as a two dimensional figure F"
Well-ordered profile: A profile where the triplet components satisfy non-decreasing order of their associated degrees, used to define ms and rs — "A triple is said to be well ordered if x corresponds to a degree of success equal or greater than y, and y corresponds to a degree of acquisition equal or greater than z."
Discussion 0