Publication
Metrics
AI Quick Summary
This paper explores machine learning techniques for clustering plasma concentration-time curves (pharmacokinetic curves) to identify patterns and similarities. The authors find Euclidean distance most effective for clustering, validating their approach with a case study of 250 PK curves that aligns with previous pharmacogenomic results, showcasing the potential of this method to generate insights beyond traditional population-level statistics.
Paper Preview
Abstract
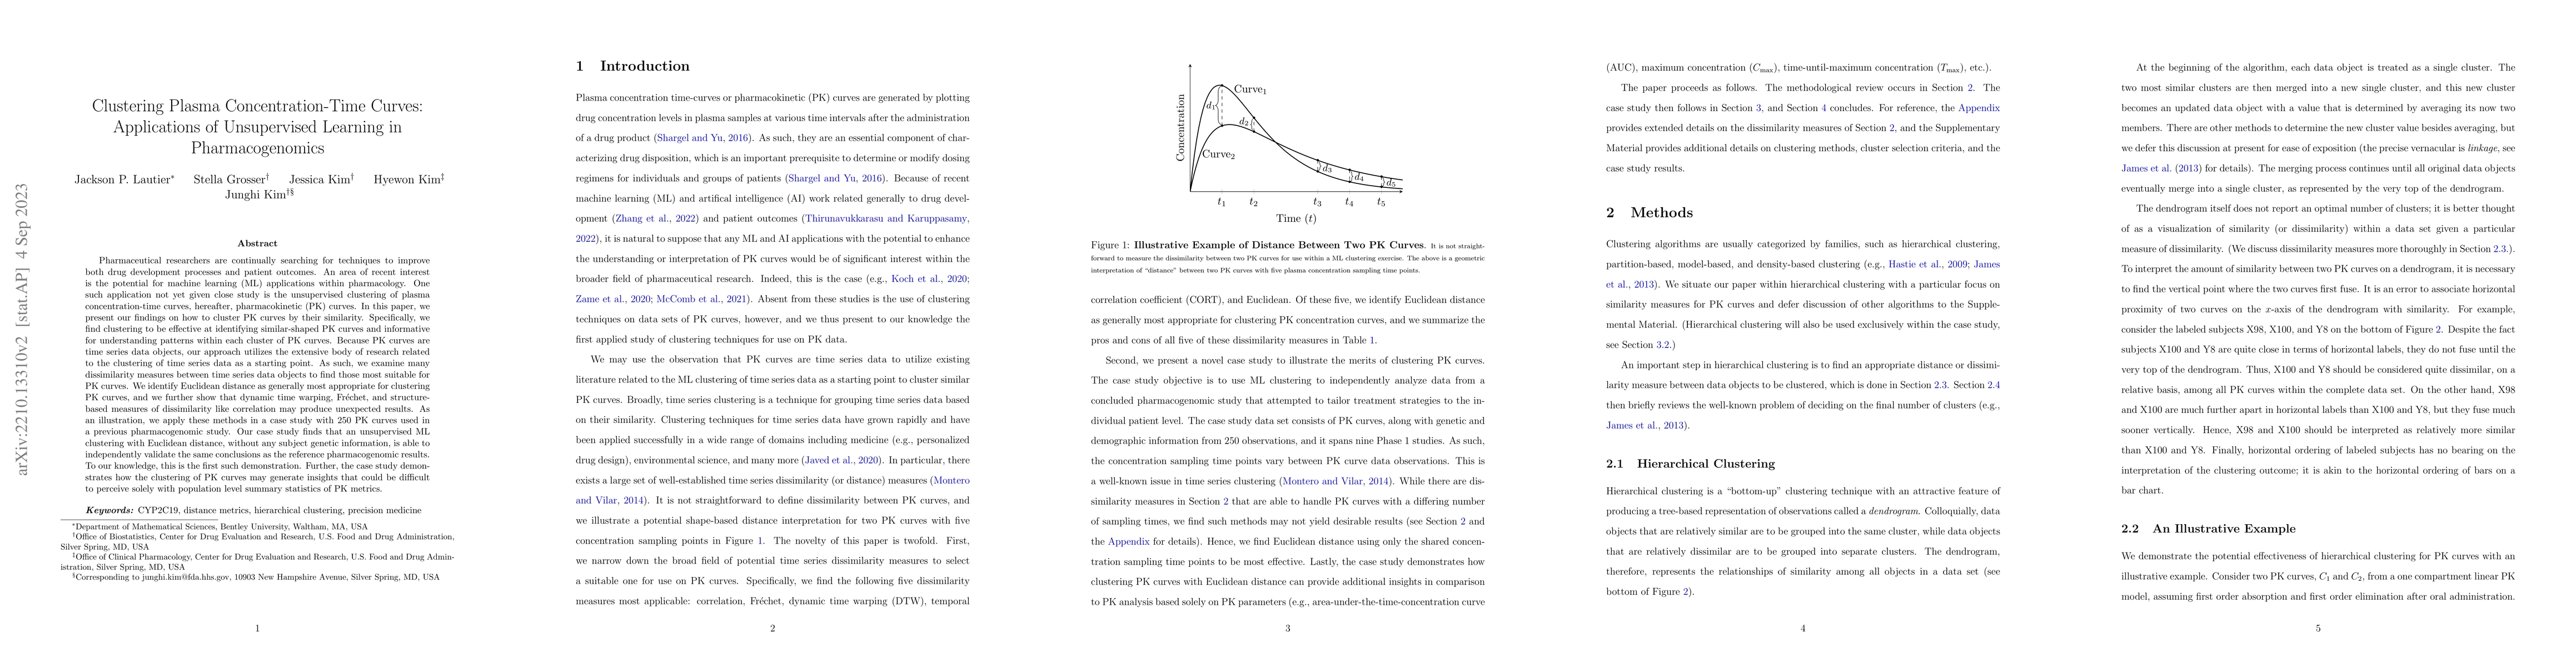
Pharmaceutical researchers are continually searching for techniques to improve both drug development processes and patient outcomes. An area of recent interest is the potential for machine learning (ML) applications within pharmacology. One such application not yet given close study is the unsupervised clustering of plasma concentration-time curves, hereafter, pharmacokinetic (PK) curves. In this paper, we present our findings on how to cluster PK curves by their similarity. Specifically, we find clustering to be effective at identifying similar-shaped PK curves and informative for understanding patterns within each cluster of PK curves. Because PK curves are time series data objects, our approach utilizes the extensive body of research related to the clustering of time series data as a starting point. As such, we examine many dissimilarity measures between time series data objects to find those most suitable for PK curves. We identify Euclidean distance as generally most appropriate for clustering PK curves, and we further show that dynamic time warping, Fr\'{e}chet, and structure-based measures of dissimilarity like correlation may produce unexpected results. As an illustration, we apply these methods in a case study with 250 PK curves used in a previous pharmacogenomic study. Our case study finds that an unsupervised ML clustering with Euclidean distance, without any subject genetic information, is able to independently validate the same conclusions as the reference pharmacogenomic results. To our knowledge, this is the first such demonstration. Further, the case study demonstrates how the clustering of PK curves may generate insights that could be difficult to perceive solely with population level summary statistics of PK metrics.
AI Key Findings
Get AI-generated insights about this paper's methodology, results, significance, and more — seven facets brought into focus.
Impact
Paper Details
Authors
PDF Preview
Key Terms
Citation Network
Current paper (gray), citations (green), references (blue)
Display is limited for performance on very large graphs.
Discussion 0