Applying Extended Object Tracking for Self-Localization of Roadside Radar Sensors
Publication
Metrics
AI Quick Summary
This paper proposes a self-localization method for roadside radar sensors using Extended Object Tracking (EOT), combining vehicle trajectory analysis with aerial laser scans to label driving behaviors and apply the Semantic Iterative Closest Points (SICP) algorithm, achieving sub-meter accuracy and low orientation error in both simulated and real-world settings.
Paper Preview
Abstract
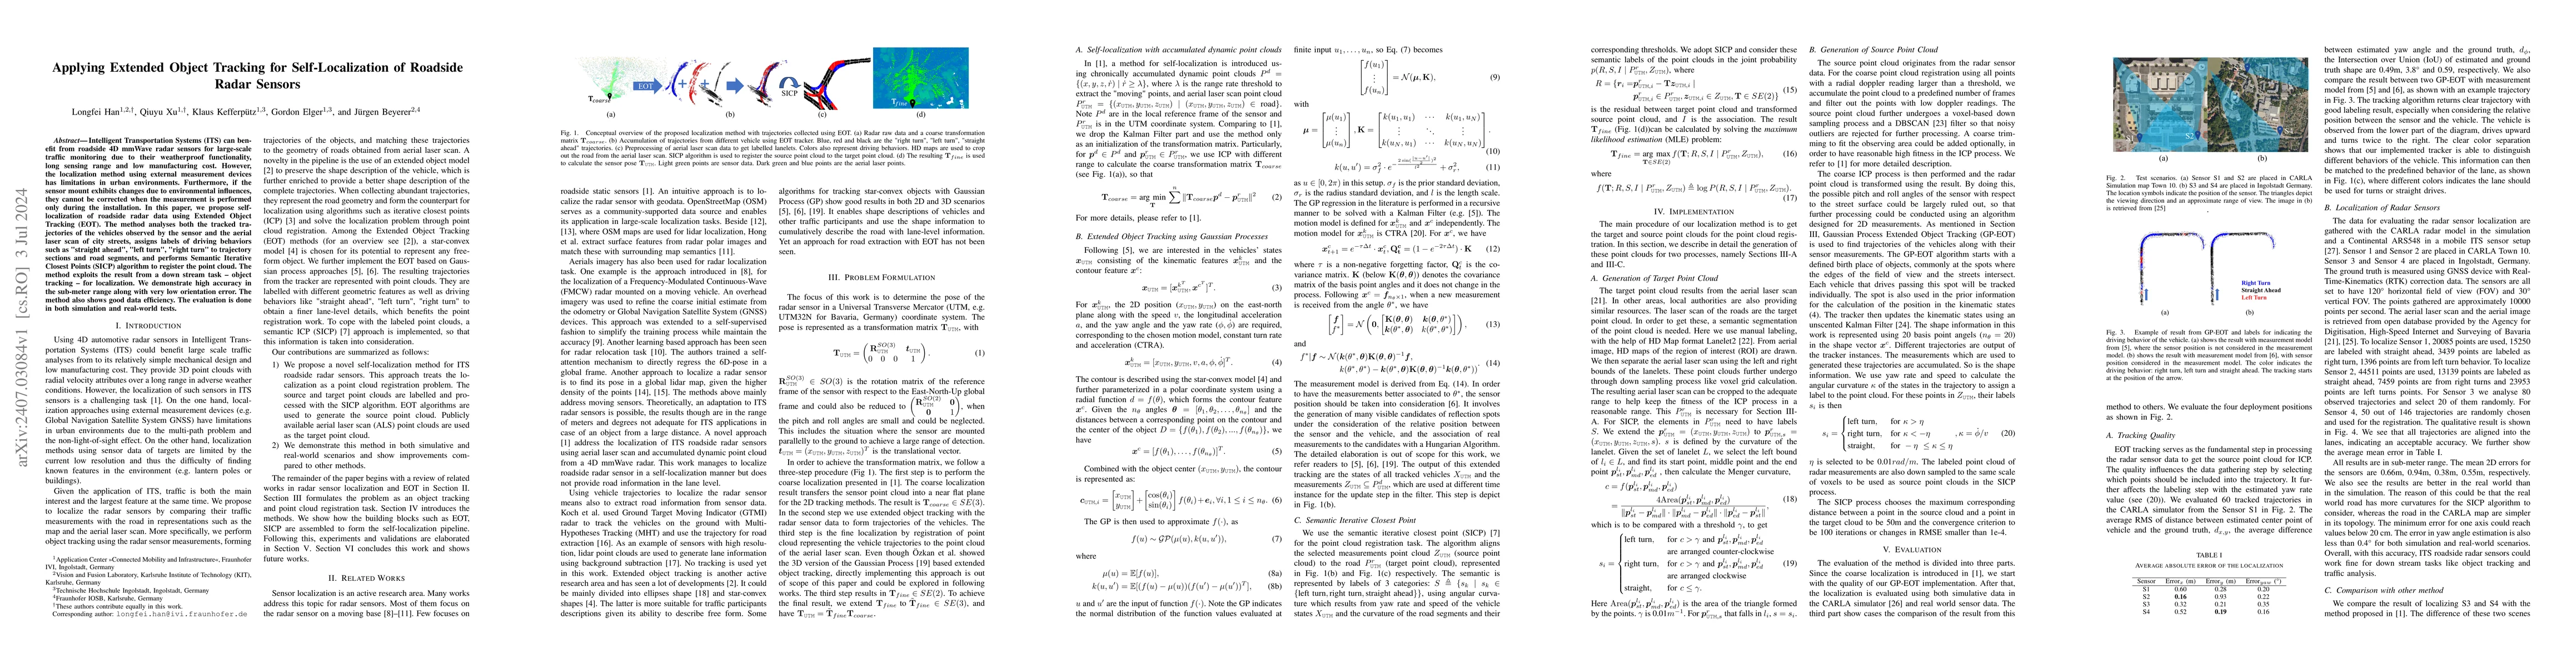
Intelligent Transportation Systems (ITS) can benefit from roadside 4D mmWave radar sensors for large-scale traffic monitoring due to their weatherproof functionality, long sensing range and low manufacturing cost. However, the localization method using external measurement devices has limitations in urban environments. Furthermore, if the sensor mount exhibits changes due to environmental influences, they cannot be corrected when the measurement is performed only during the installation. In this paper, we propose self-localization of roadside radar data using Extended Object Tracking (EOT). The method analyses both the tracked trajectories of the vehicles observed by the sensor and the aerial laser scan of city streets, assigns labels of driving behaviors such as "straight ahead", "left turn", "right turn" to trajectory sections and road segments, and performs Semantic Iterative Closest Points (SICP) algorithm to register the point cloud. The method exploits the result from a down stream task -- object tracking -- for localization. We demonstrate high accuracy in the sub-meter range along with very low orientation error. The method also shows good data efficiency. The evaluation is done in both simulation and real-world tests.
AI Key Findings
Get AI-generated insights about this paper's methodology, results, significance, and more — seven facets brought into focus.
Impact
Paper Details
Authors
PDF Preview
Key Terms
Citation Network
Current paper (gray), citations (green), references (blue)
Display is limited for performance on very large graphs.
Discussion 0