Applying Machine Learning and AI Explanations to Analyze Vaccine Hesitancy
Publication
Metrics
AI Quick Summary
This research applies machine learning and AI explanations to analyze COVID-19 vaccine hesitancy in US counties, finding that factors like political affiliation, race, and poverty significantly impact vaccination rates. An interactive online dashboard visualizes these findings for tailored local insights.
Paper Preview
Abstract
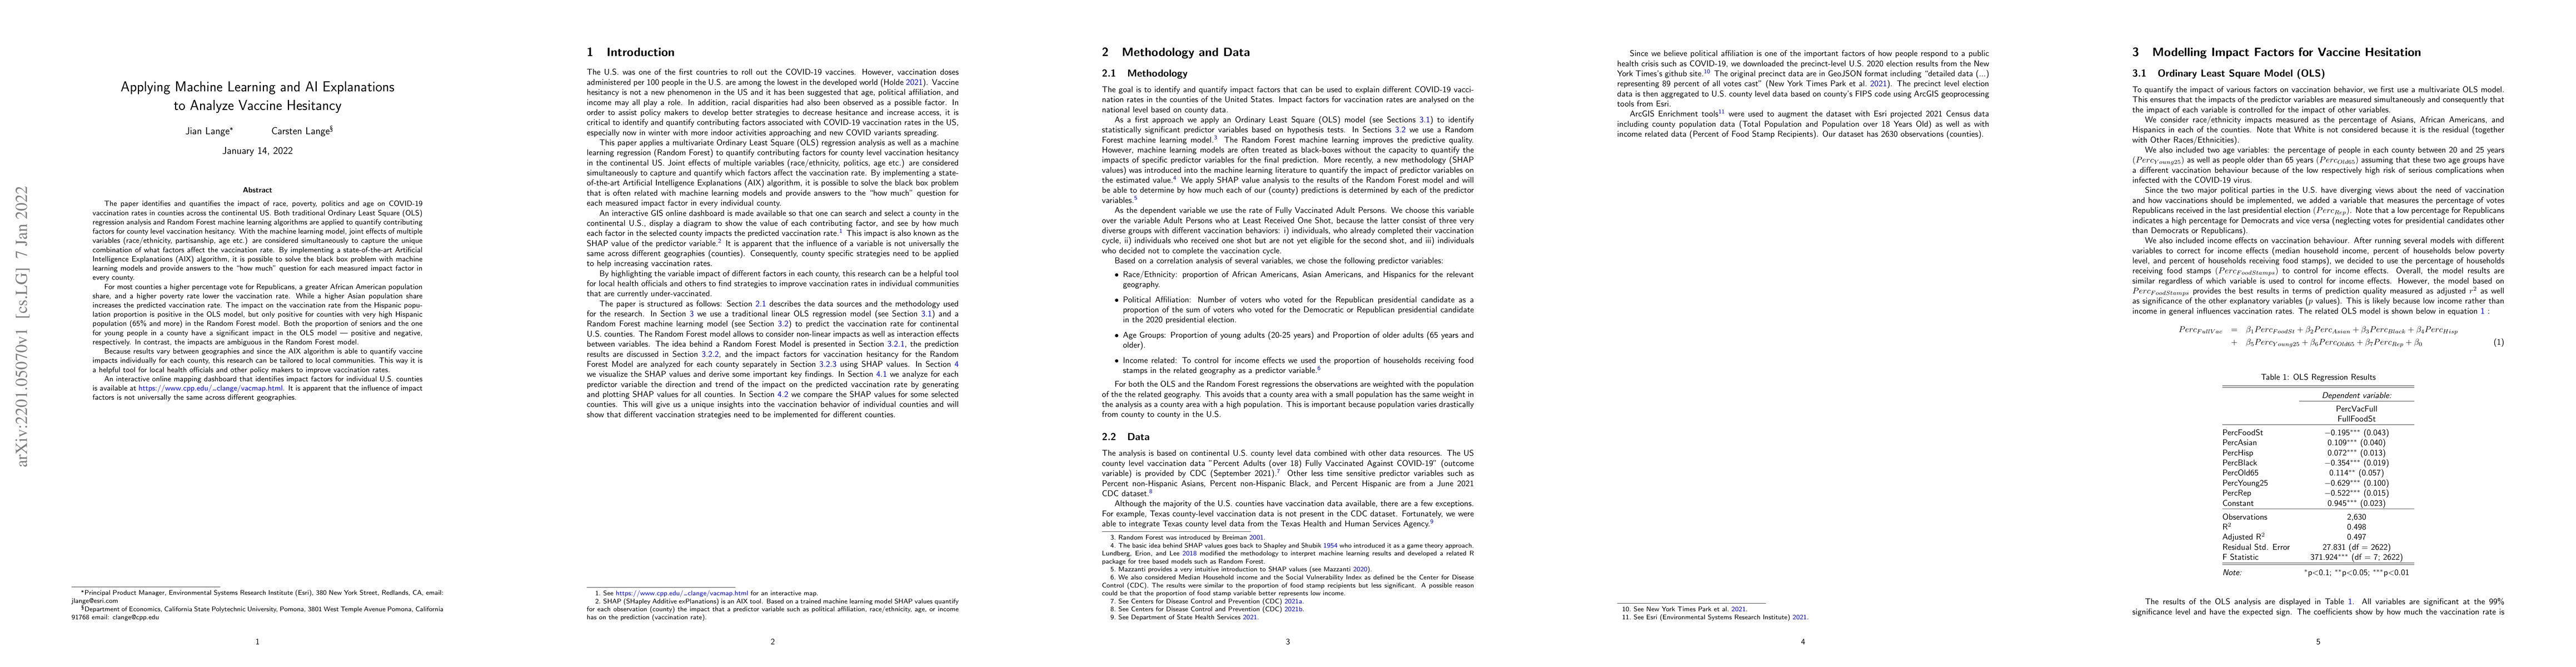
The paper quantifies the impact of race, poverty, politics, and age on COVID-19 vaccination rates in counties in the continental US. Both, OLS regression analysis and Random Forest machine learning algorithms are applied to quantify factors for county-level vaccination hesitancy. The machine learning model considers joint effects of variables (race/ethnicity, partisanship, age, etc.) simultaneously to capture the unique combination of these factors on the vaccination rate. By implementing a state-of-the-art Artificial Intelligence Explanations (AIX) algorithm, it is possible to solve the black box problem with machine learning models and provide answers to the "how much" question for each measured impact factor in every county. For most counties, a higher percentage vote for Republicans, a greater African American population share, and a higher poverty rate lower the vaccination rate. While a higher Asian population share increases the predicted vaccination rate. The impact on the vaccination rate from the Hispanic population proportion is positive in the OLS model, but only positive for counties with a high Hispanic population (>65%) in the Random Forest model. Both the proportion of seniors and the one for young people in a county have a significant impact in the OLS model - positive and negative, respectively. In contrast, the impacts are ambiguous in the Random Forest model. Because results vary between geographies and since the AIX algorithm is able to quantify vaccine impacts individually for each county, this research can be tailored to local communities. An interactive online mapping dashboard that identifies impact factors for individual U.S. counties is available at https://www.cpp.edu/~clange/vacmap.html. It is apparent that the influence of impact factors is not universally the same across different geographies.
AI Key Findings
Get AI-generated insights about this paper's methodology, results, significance, and more — seven facets brought into focus.
Impact
Paper Details
Authors
PDF Preview
Key Terms
Citation Network
Current paper (gray), citations (green), references (blue)
Display is limited for performance on very large graphs.
Discussion 0