Archetypal solution spaces for clustering gene expression datasets in identification of cancer subtypes
Publication
Metrics
AI Quick Summary
This paper uses $K$-means clustering and energy landscape theory to analyze gene expression datasets, revealing a single-funnelled structure in the solution space for the correct number of cancer subtypes. The frustration metric quantifies this structure, potentially offering a new diagnostic tool for identifying optimal cancer subtype classifications.
Paper Preview
Abstract
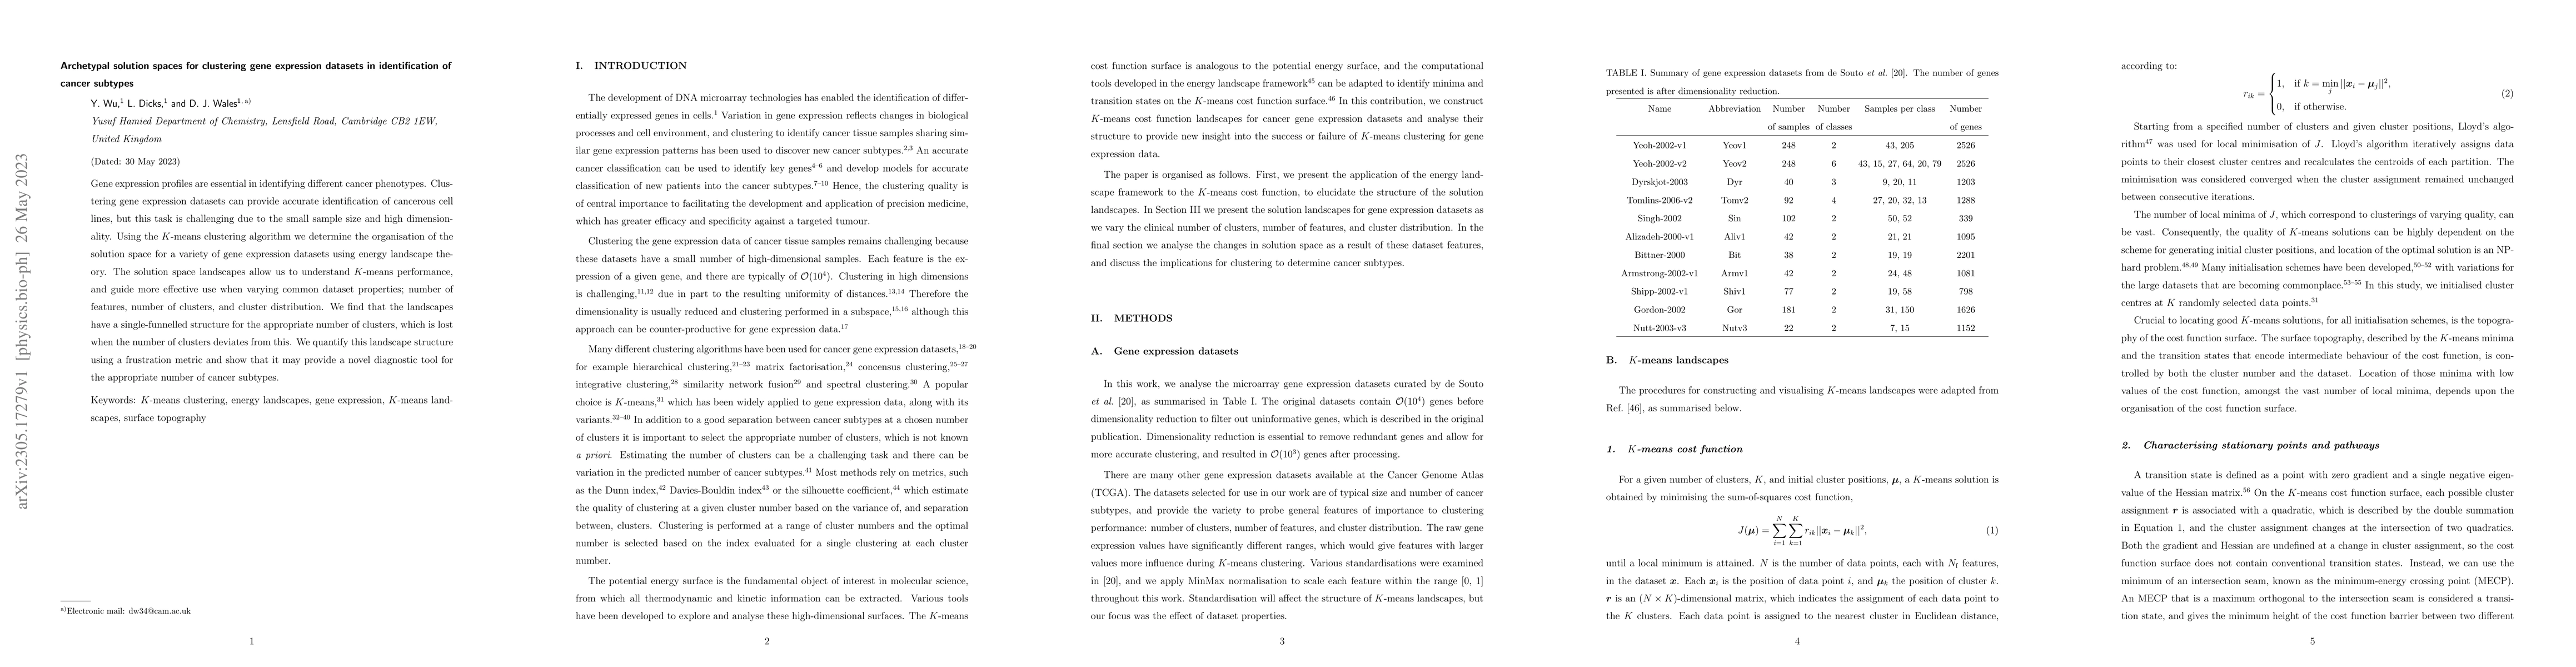
Gene expression profiles are essential in identifying different cancer phenotypes. Clustering gene expression datasets can provide accurate identification of cancerous cell lines, but this task is challenging due to the small sample size and high dimensionality. Using the $K$-means clustering algorithm we determine the organisation of the solution space for a variety of gene expression datasets using energy landscape theory. The solution space landscapes allow us to understand $K$-means performance, and guide more effective use when varying common dataset properties; number of features, number of clusters, and cluster distribution. We find that the landscapes have a single-funnelled structure for the appropriate number of clusters, which is lost when the number of clusters deviates from this. We quantify this landscape structure using a frustration metric and show that it may provide a novel diagnostic tool for the appropriate number of cancer subtypes.
AI Key Findings
Get AI-generated insights about this paper's methodology, results, significance, and more — seven facets brought into focus.
Impact
Paper Details
Authors
PDF Preview
Key Terms
Citation Network
Current paper (gray), citations (green), references (blue)
Display is limited for performance on very large graphs.
Discussion 0