Publication
Metrics
AI Quick Summary
This paper reviews various metrics used to quantify Arctic Amplification (AA) and assesses their consistency across different datasets. It finds that while reanalysis products like NOAA and ERA 20th Century Reanalysis match observations closely, there are significant seasonal and temporal differences, especially during the early warming period due to sparse data. In the modern warming period, high observation density aligns all products closely.
Paper Preview
Abstract
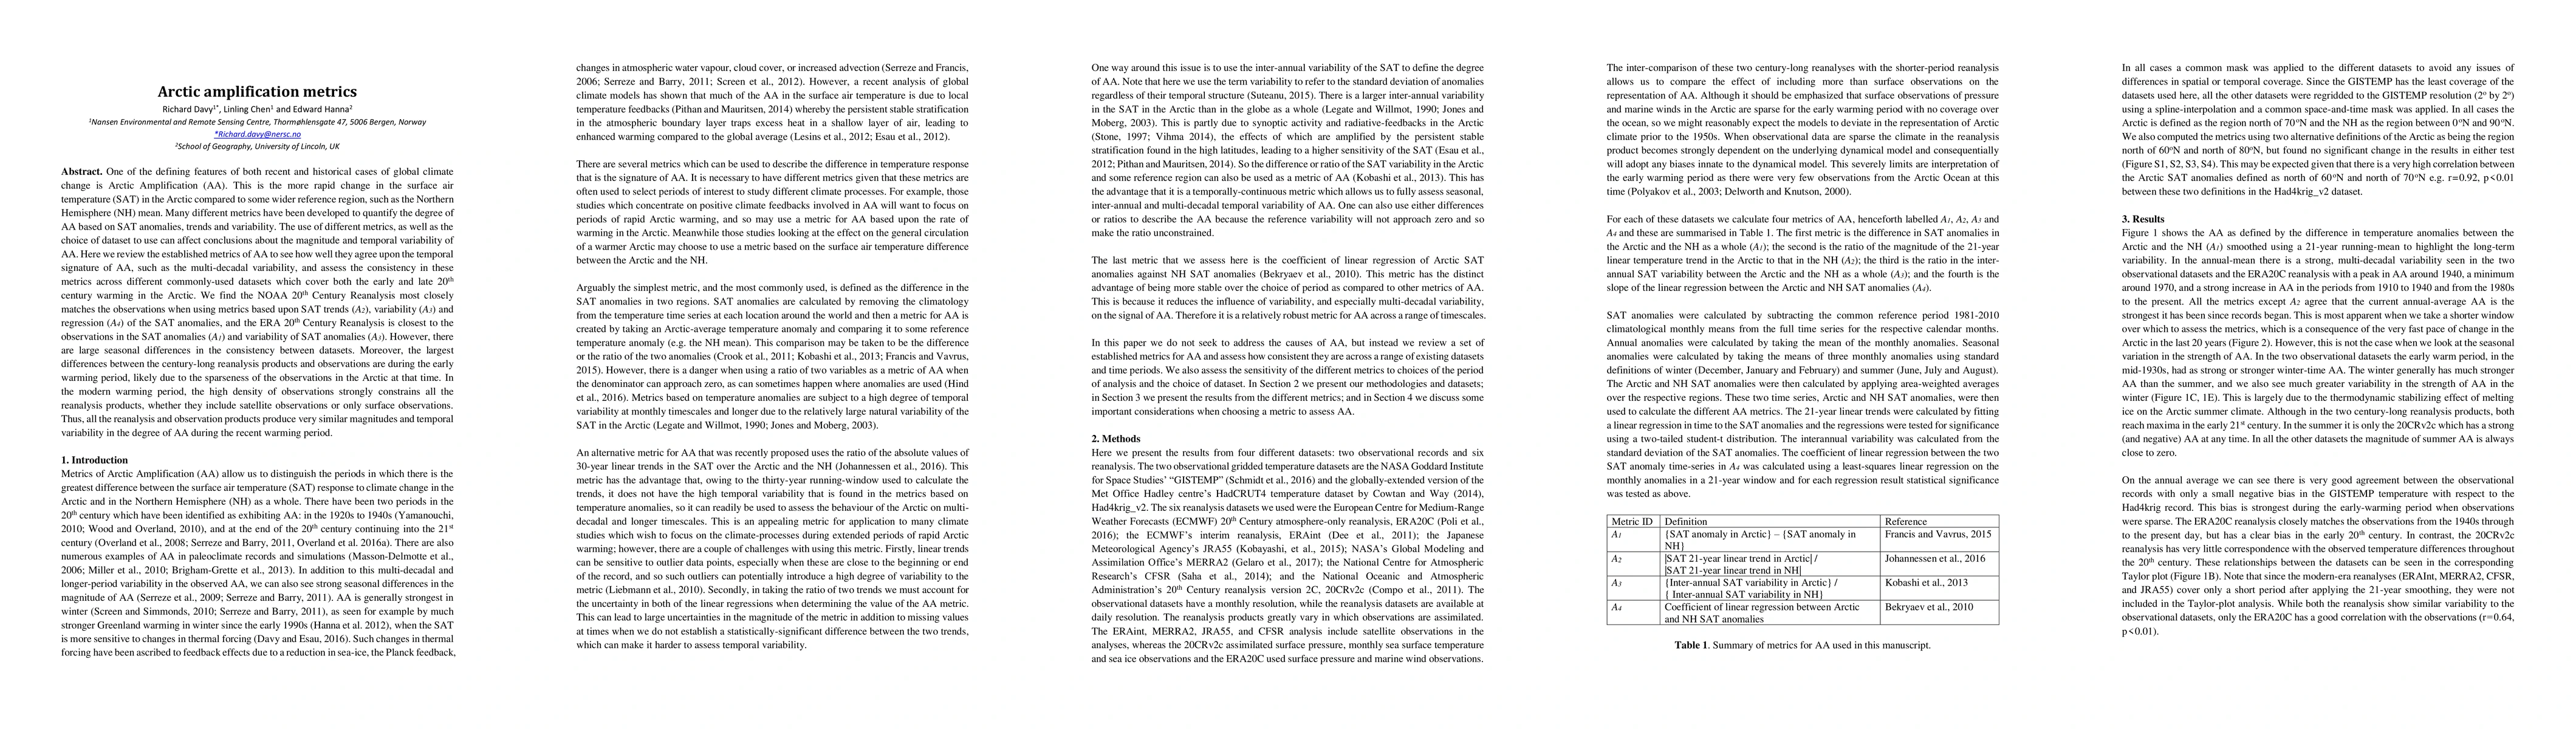
One of the defining features of both recent and historical cases of global climate change is Arctic Amplification (AA). This is the more rapid change in the surface air temperature (SAT) in the Arctic compared to some wider reference region, such as the Northern Hemisphere (NH) mean. Many different metrics have been developed to quantify the degree of AA based on SAT anomalies, trends and variability. The use of different metrics, as well as the choice of dataset to use can affect conclusions about the magnitude and temporal variability of AA. Here we review the established metrics of AA to see how well they agree upon the temporal signature of AA, such as the multi-decadal variability, and assess the consistency in these metrics across different commonly-used datasets which cover both the early and late 20th century warming in the Arctic. We find the NOAA 20th Century Reanalysis most closely matches the observations when using metrics based upon SAT trends (A2), variability (A3) and regression (A4) of the SAT anomalies, and the ERA 20th Century Reanalysis is closest to the observations in the SAT anomalies (A1) and variability of SAT anomalies (A3). However, there are large seasonal differences in the consistency between datasets. Moreover, the largest differences between the century-long reanalysis products and observations are during the early warming period, likely due to the sparseness of the observations in the Arctic at that time. In the modern warming period, the high density of observations strongly constrains all the reanalysis products, whether they include satellite observations or only surface observations. Thus, all the reanalysis and observation products produce very similar magnitudes and temporal variability in the degree of AA during the recent warming period.
AI Key Findings
Get AI-generated insights about this paper's methodology, results, significance, and more — seven facets brought into focus.
Impact
Paper Details
PDF Preview
Key Terms
Citation Network
Current paper (gray), citations (green), references (blue)
Display is limited for performance on very large graphs.
Discussion 0