Quick Summary:

Argo Lite is an open-source, in-browser tool for interactive graph exploration and visualization, designed for web-based collaborative analysis and incremental exploration. It leverages WebGL for high-performance rendering and has been successfully used by students for data visualization in a university course.

Summary

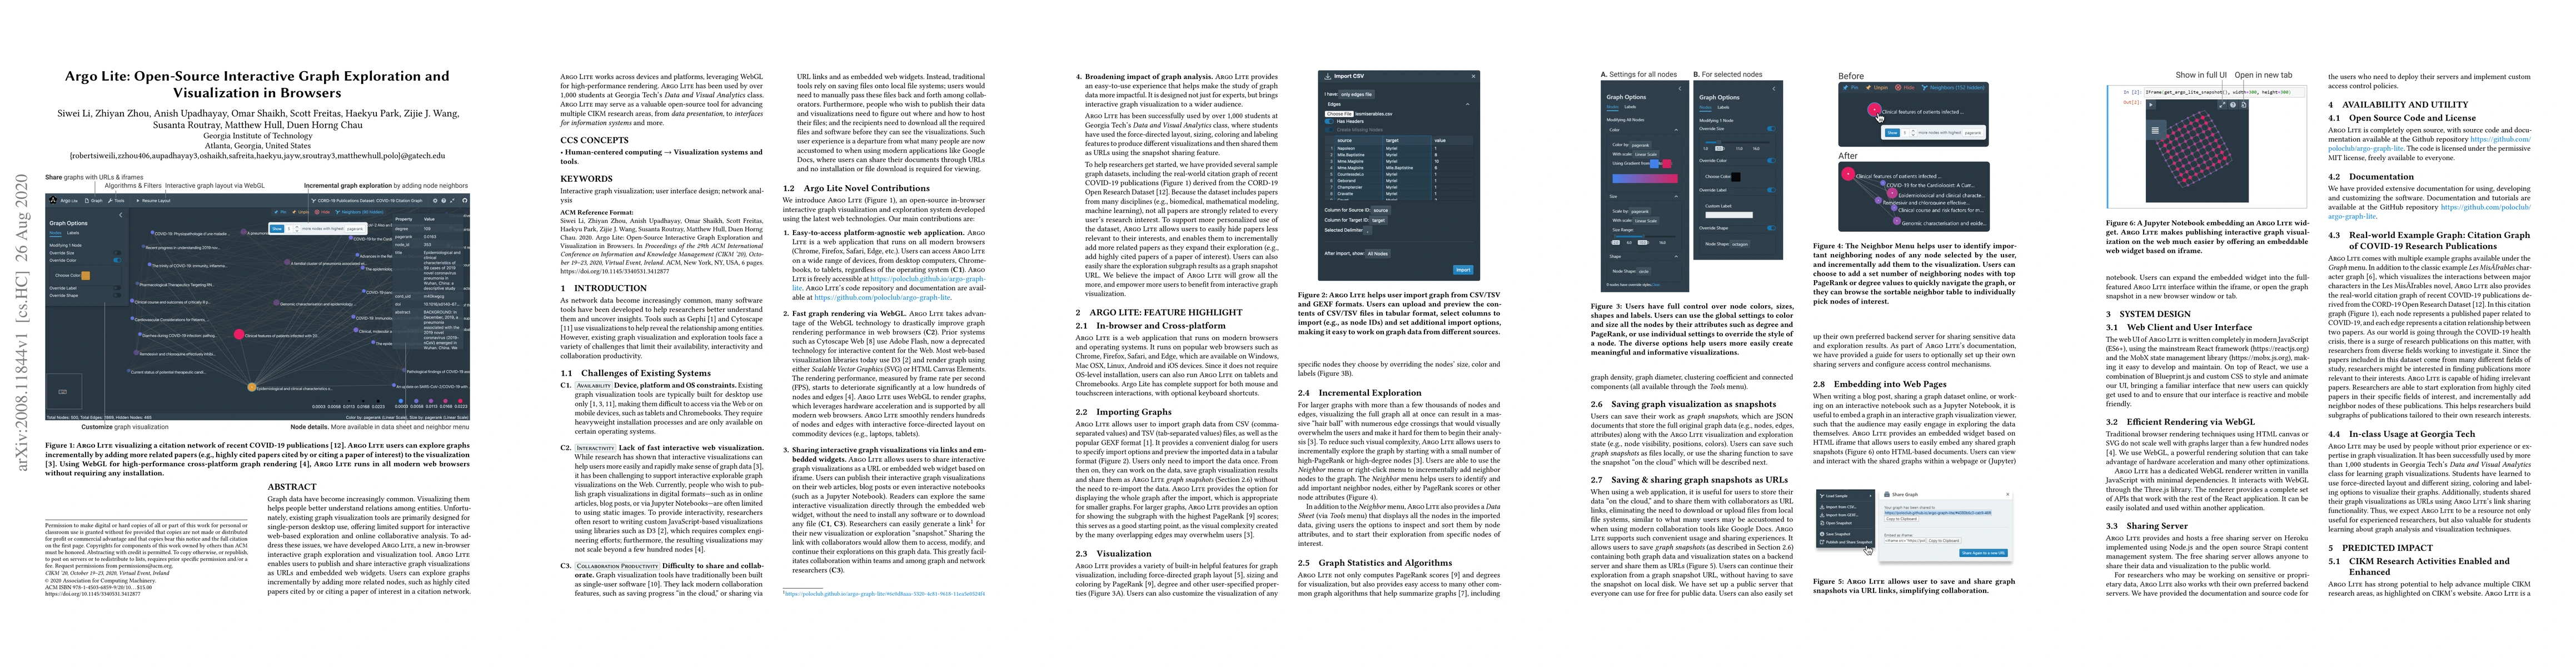
Graph data have become increasingly common. Visualizing them helps people better understand relations among entities. Unfortunately, existing graph visualization tools are primarily designed for single-person desktop use, offering limited support for interactive web-based exploration and online collaborative analysis. To address these issues, we have developed Argo Lite, a new in-browser interactive graph exploration and visualization tool. Argo Lite enables users to publish and share interactive graph visualizations as URLs and embedded web widgets. Users can explore graphs incrementally by adding more related nodes, such as highly cited papers cited by or citing a paper of interest in a citation network. Argo Lite works across devices and platforms, leveraging WebGL for high-performance rendering. Argo Lite has been used by over 1,000 students at Georgia Tech's Data and Visual Analytics class. Argo Lite may serve as a valuable open-source tool for advancing multiple CIKM research areas, from data presentation, to interfaces for information systems and more.

AI Key Findings

Get AI-generated insights about this paper's methodology, results, and significance.

Paper Details

PDF Preview

Download PDF

Key Terms

interactive (0.294)
interactive (0.292)
visualization (0.233)
web (0.220)
graph (0.212)
graph (0.212)
exploration (0.211)
web (0.208)
exploration (0.206)
users (0.178)
users (0.177)
tool (0.167)
tool (0.161)
citation (0.156)
students (0.145)
collaborative (0.145)
person (0.142)
presentation (0.140)
presentation (0.139)
high performance (0.139)

Citation Network

Current paper (gray), citations (green), references (blue)

Current Paper
Citations
References
Click to view
Title Authors Year Actions
SNoMaN: a visual analytic tool for spatial social network mapping and analysis
Sichen Jin, Alex Endert, Clio Andris
2024
View Paper
Empowering Interdisciplinary Insights with Dynamic Graph Embedding Trajectories
Yiqiao Jin, Andrew Zhao, Yeon-Chang Lee, Meng Ye, Ajay Divakaran, Srijan Kumar
2024
View Paper
CallMine: Fraud Detection and Visualization of Million-Scale Call Graphs
M. Cazzolato, Saranya Vijayakumar, Meng-Chieh Lee, Catalina Vajiac, Namyong Park, Pedro Fidalgo, A. J. Traina, Christos Faloutsos
2023
View Paper
SuperNOVA: Design Strategies and Opportunities for Interactive Visualization in Computational Notebooks
Zijie J. Wang, David Munechika, Seongmin Lee, Duen Horng Chau
2023
View Paper
Visual Exploration of Literature with Argo Scholar
K. Li, Haoyang Yang, Evan Montoya, Anish Upadhayay, Zhiyan Zhou, Jon Saad-Falcon, Duen Horng Chau
2022
View Paper
StickyLand: Breaking the Linear Presentation of Computational Notebooks
Zijie J. Wang, Katie Dai, W. K. Edwards
2022
View Paper
Argo Scholar: Interactive Visual Exploration of Literature in Browsers
Kevin Li, Haoyang Yang, Anish Upadhayay, Zhiyan Zhou, Jon Saad-Falcon, Duen Horng Chau
2021
View Paper
Dash Sylvereye: A WebGL-powered Library for Dashboard-driven Visualization of Large Street Networks
A. Garcia-Robledo, M. Zangiabady
2021
View Paper
Dash Sylvereye: A Python Library for Dashboard-Driven Visualization of Large Street Networks
A. Garcia-Robledo, M. Zangiabady
2023
View Paper
Different genetic architectures of complex traits and 1 their relevance to polygenic score performance
Nuno R. G. Carvalho, A. Harris, J. Lachance
2022
View Paper

Comments (0)

This website uses cookies to ensure you get the best experience. Learn more