Publication
Metrics
AI Quick Summary
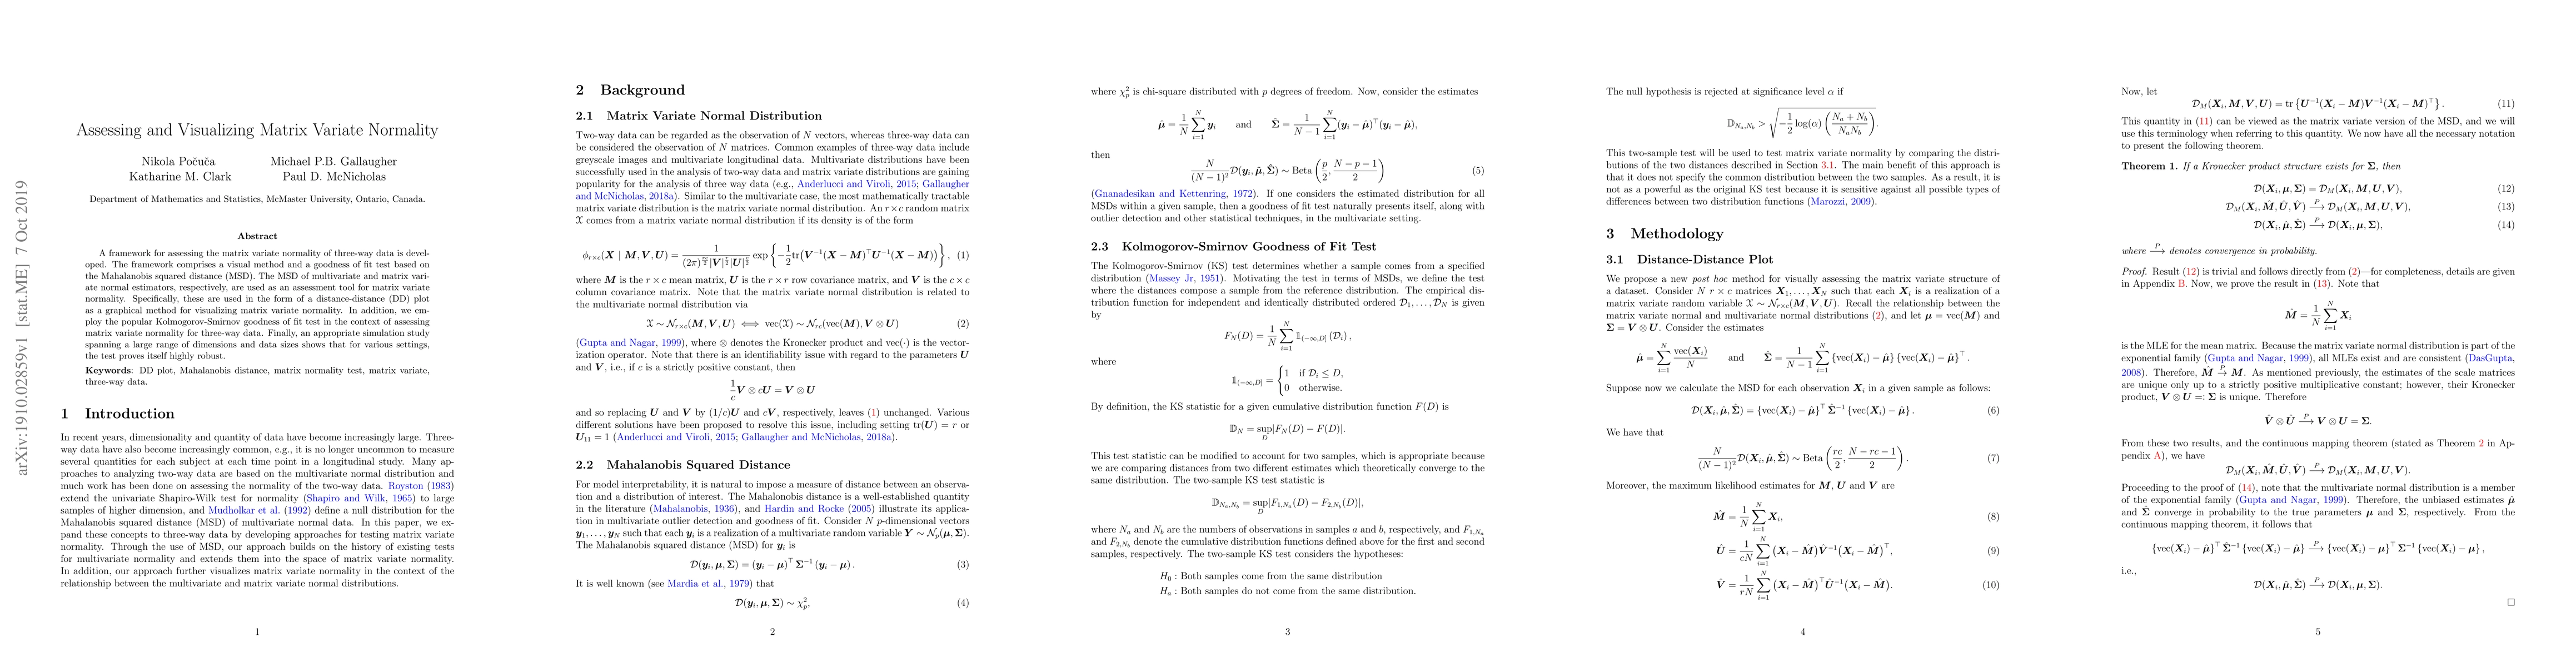
This paper develops a framework for assessing matrix variate normality in three-way data using a visual method and a goodness of fit test based on Mahalanobis squared distance, employing a distance-distance plot for visualization and the Kolmogorov-Smirnov test for robustness, validated through extensive simulations.
Paper Preview
Abstract
A framework for assessing the matrix variate normality of three-way data is developed. The framework comprises a visual method and a goodness of fit test based on the Mahalanobis squared distance (MSD). The MSD of multivariate and matrix variate normal estimators, respectively, are used as an assessment tool for matrix variate normality. Specifically, these are used in the form of a distance-distance (DD) plot as a graphical method for visualizing matrix variate normality. In addition, we employ the popular Kolmogorov-Smirnov goodness of fit test in the context of assessing matrix variate normality for three-way data. Finally, an appropriate simulation study spanning a large range of dimensions and data sizes shows that for various settings, the test proves itself highly robust.
AI Key Findings
Get AI-generated insights about this paper's methodology, results, significance, and more — seven facets brought into focus.
Impact
Paper Details
Authors
PDF Preview
Key Terms
Citation Network
Current paper (gray), citations (green), references (blue)
Display is limited for performance on very large graphs.
Discussion 0