Assessing Y-Axis Influence: Bias in Multimodal Language Models on Chart-to-Table Translation
Publication
Metrics
AI Quick Summary
The study introduces FairChart2Table to detect biases in how chart Y-axis details affect multimodal language models translating charts to tables. It finds significant biases linked to tick value formats, tick counts, value ranges, and legends, and shows that providing Y-axis information in prompts can improve model performance for some models.
Paper Preview
Abstract
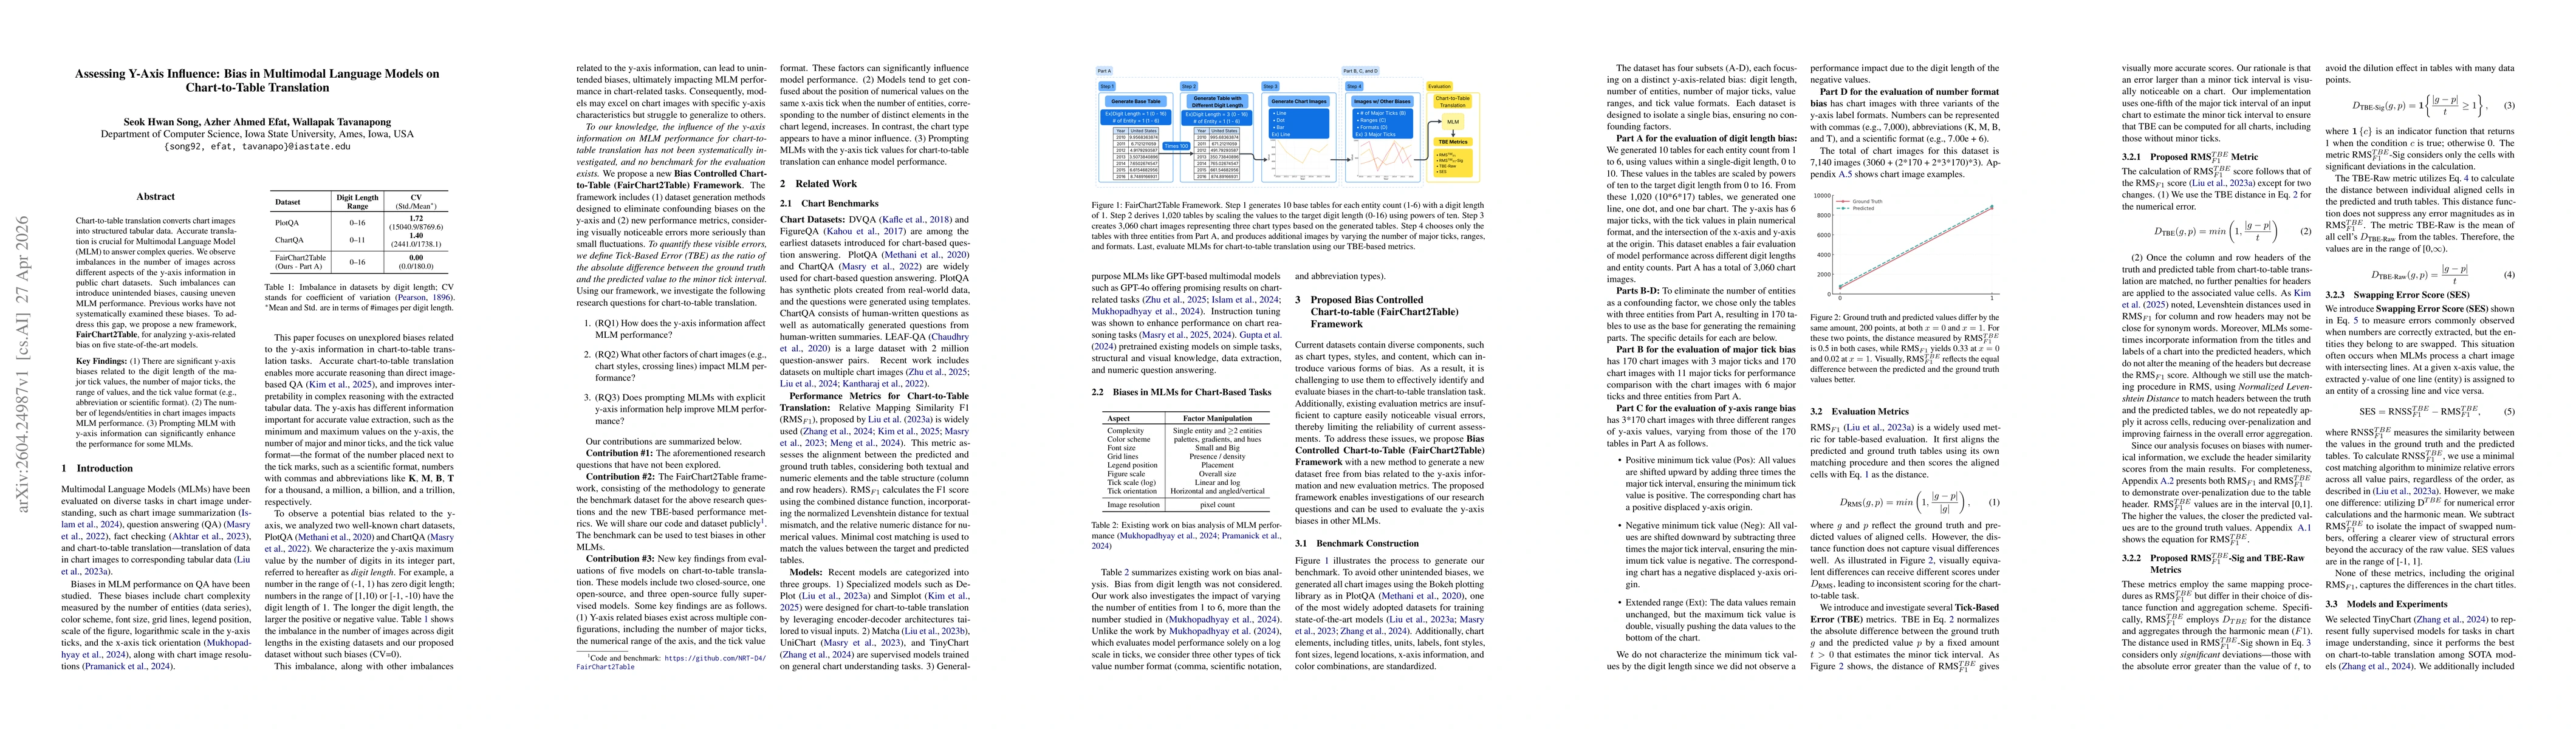
Chart-to-table translation converts chart images into structured tabular data. Accurate translation is crucial for Multimodal Language Model (MLM) to answer complex queries. We observe imbalances in the number of images across different aspects of the y-axis information in public chart datasets. Such imbalances can introduce unintended biases, causing uneven MLM performance. Previous works have not systematically examined these biases. To address this gap, we propose a new framework, FairChart2Table, for analyzing y-axis-related bias on five state-of-the-art models. Key Findings: (1) There are significant y-axis biases related to the digit length of the major tick values, the number of major ticks, the range of values, and the tick value format (e.g., abbreviation or scientific format). (2) The number of legends/entities in chart images impacts MLM performance. (3) Prompting MLM with y-axis information can significantly enhance the performance for some MLMs.
AI Key Findings
Get AI-generated insights about this paper's methodology, results, significance, and more — seven facets brought into focus.
Discussion 0