Assignment-Control Plots: A Visual Companion for Causal Inference Study Design
Publication
Metrics
AI Quick Summary
Researchers propose a new visualization tool to help understand baseline variation in causal inference studies, aiming to reduce bias and improve precision of effect estimates. Assignment-control plots offer a practical way to visualize key concepts of causality and inform study design.
Paper Preview
Abstract
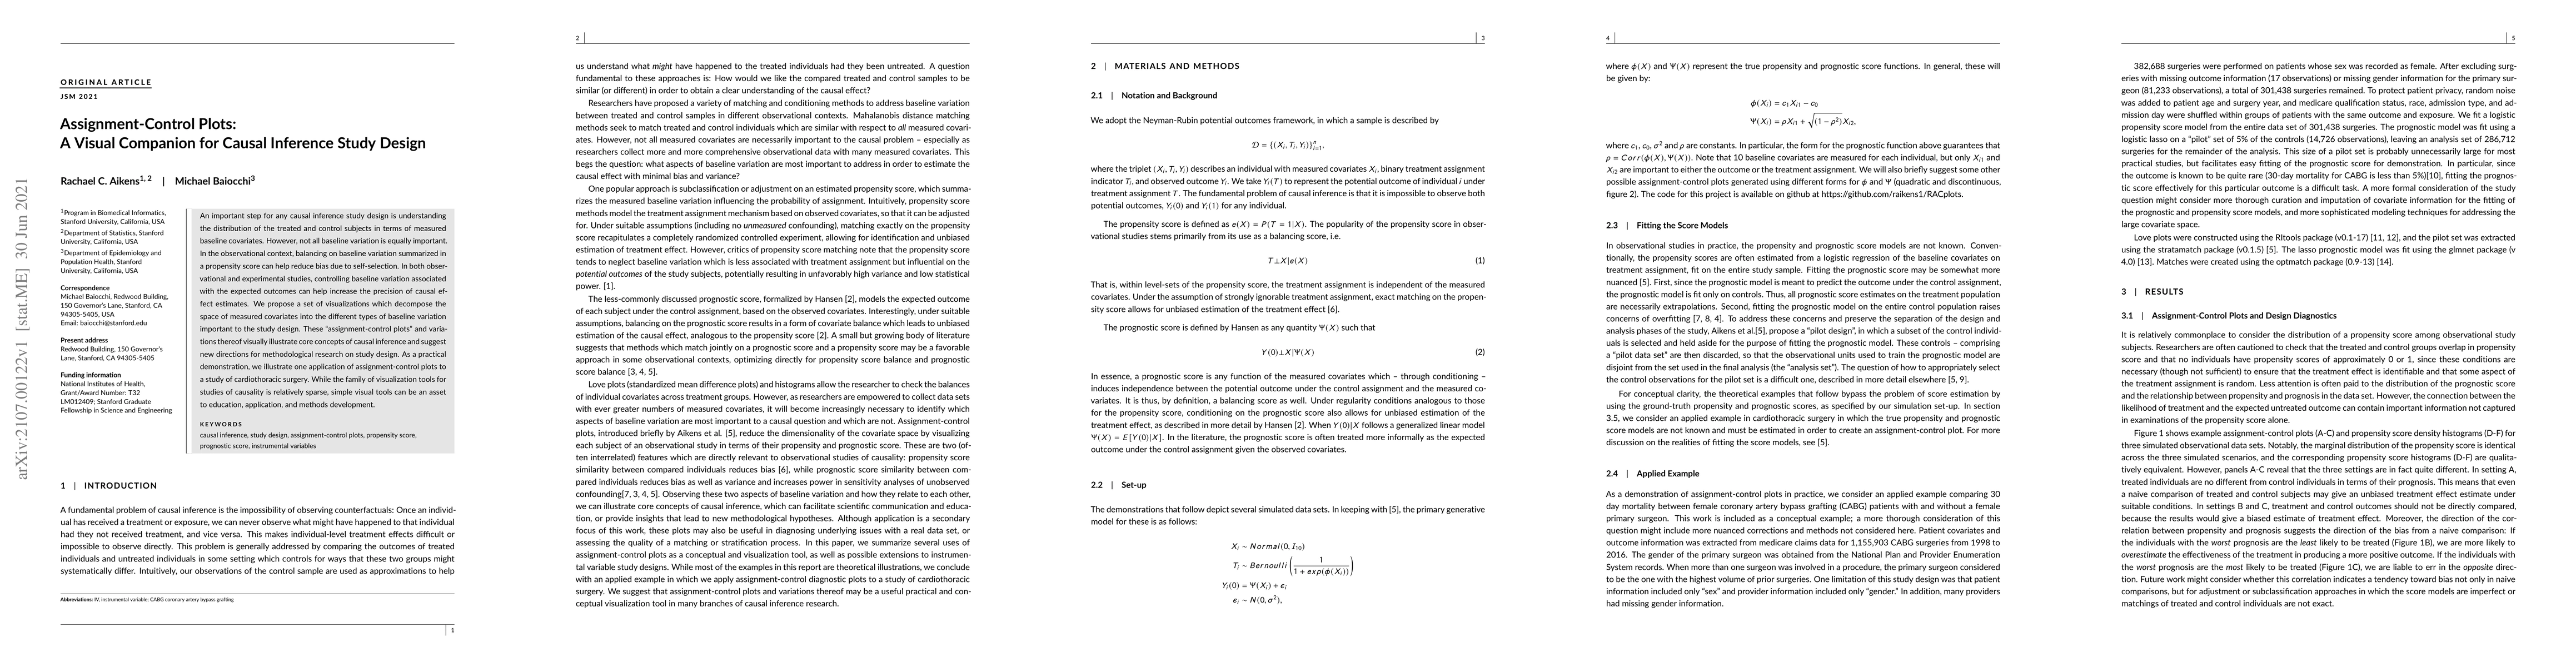
An important step for any causal inference study design is understanding the distribution of the treated and control subjects in terms of measured baseline covariates. However, not all baseline variation is equally important. In the observational context, balancing on baseline variation summarized in a propensity score can help reduce bias due to self-selection. In both observational and experimental studies, controlling baseline variation associated with the expected outcomes can help increase the precision of causal effect estimates. We propose a set of visualizations which decompose the space of measured covariates into the different types of baseline variation important to the study design. These ``assignment-control plots'' and variations thereof visually illustrate core concepts of causal inference and suggest new directions for methodological research on study design. As a practical demonstration, we illustrate one application of assignment-control plots to a study of cardiothoracic surgery. While the family of visualization tools for studies of causality is relatively sparse, simple visual tools can be an asset to education, application, and methods development.
AI Key Findings
Get AI-generated insights about this paper's methodology, results, significance, and more — seven facets brought into focus.
Impact
Paper Details
Authors
PDF Preview
Key Terms
Citation Network
Current paper (gray), citations (green), references (blue)
Display is limited for performance on very large graphs.
Discussion 0