ASTF: Visual Abstractions of Time-Varying Patterns in Radio Signals
Publication
Metrics
AI Quick Summary
This paper introduces the ASTF diagram, a novel visual abstraction method to effectively represent long-term time-varying patterns in radio signals. It employs a time segmentation algorithm and new metrics to preserve essential information, validated through experiments and user studies.
Paper Preview
Abstract
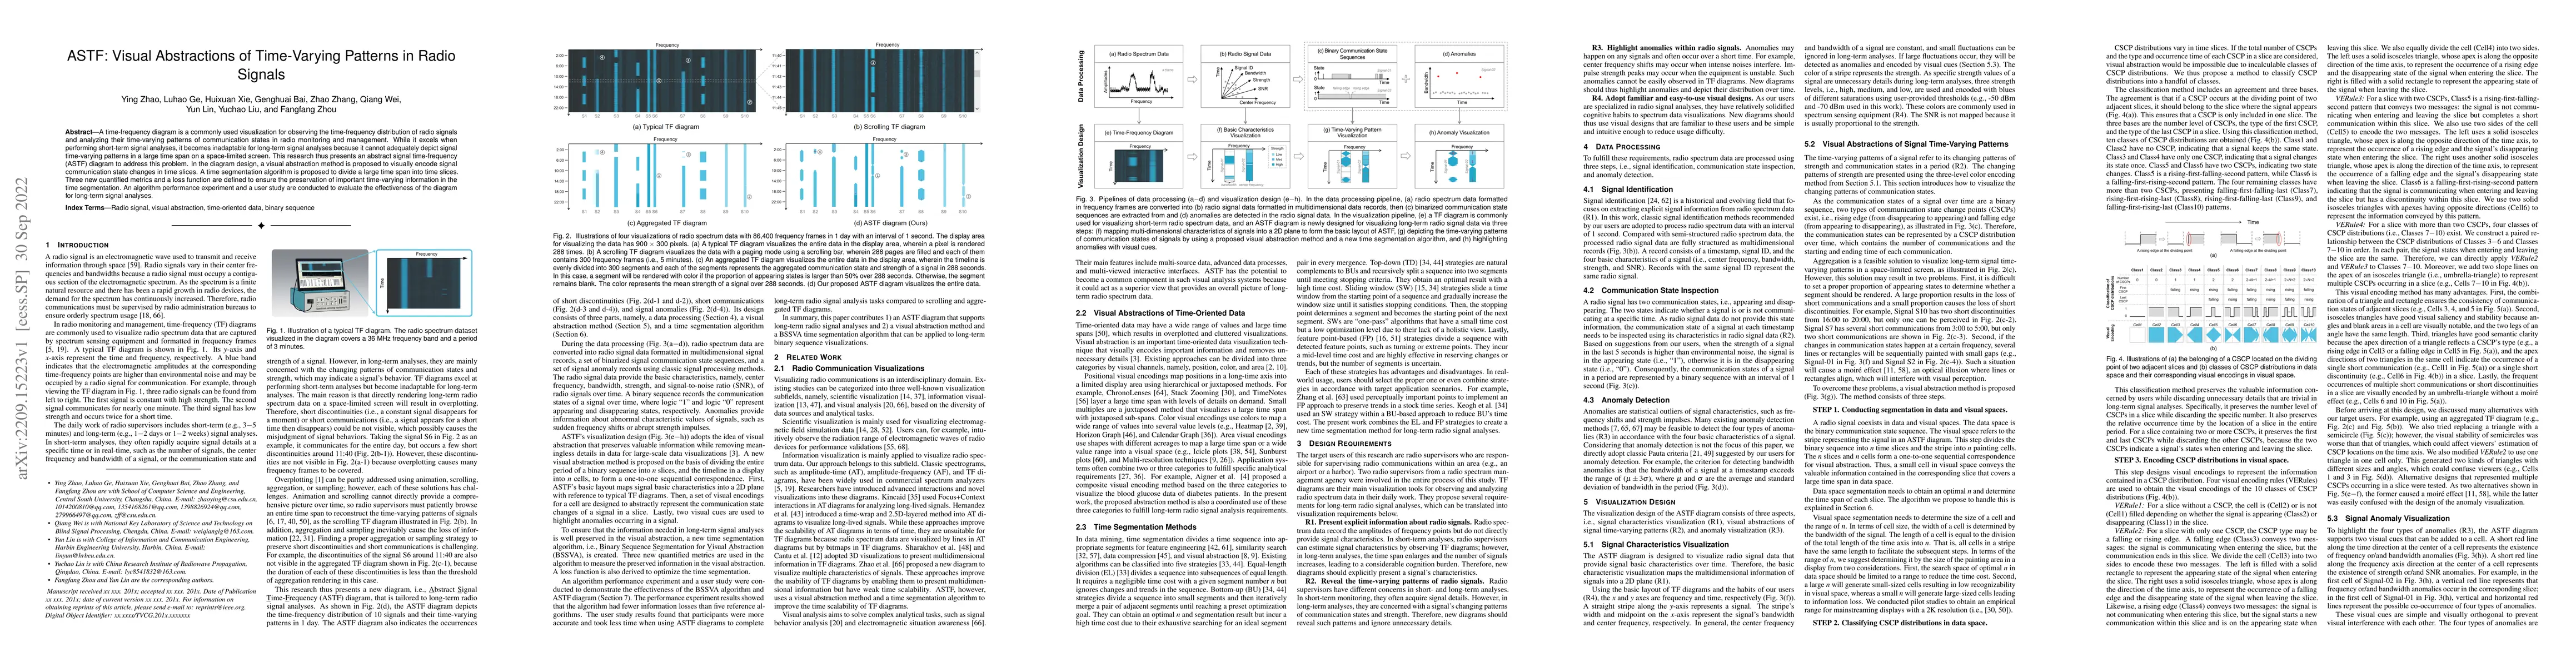
A time-frequency diagram is a commonly used visualization for observing the time-frequency distribution of radio signals and analyzing their time-varying patterns of communication states in radio monitoring and management. While it excels when performing short-term signal analyses, it becomes inadaptable for long-term signal analyses because it cannot adequately depict signal time-varying patterns in a large time span on a space-limited screen. This research thus presents an abstract signal time-frequency (ASTF) diagram to address this problem. In the diagram design, a visual abstraction method is proposed to visually encode signal communication state changes in time slices. A time segmentation algorithm is proposed to divide a large time span into time slices.Three new quantified metrics and a loss function are defined to ensure the preservation of important time-varying information in the time segmentation. An algorithm performance experiment and a user study are conducted to evaluate the effectiveness of the diagram for long-term signal analyses.
AI Key Findings
Get AI-generated insights about this paper's methodology, results, significance, and more — seven facets brought into focus.
Impact
Paper Details
Authors
PDF Preview
Key Terms
Citation Network
Current paper (gray), citations (green), references (blue)
Display is limited for performance on very large graphs.
Discussion 0