Summary
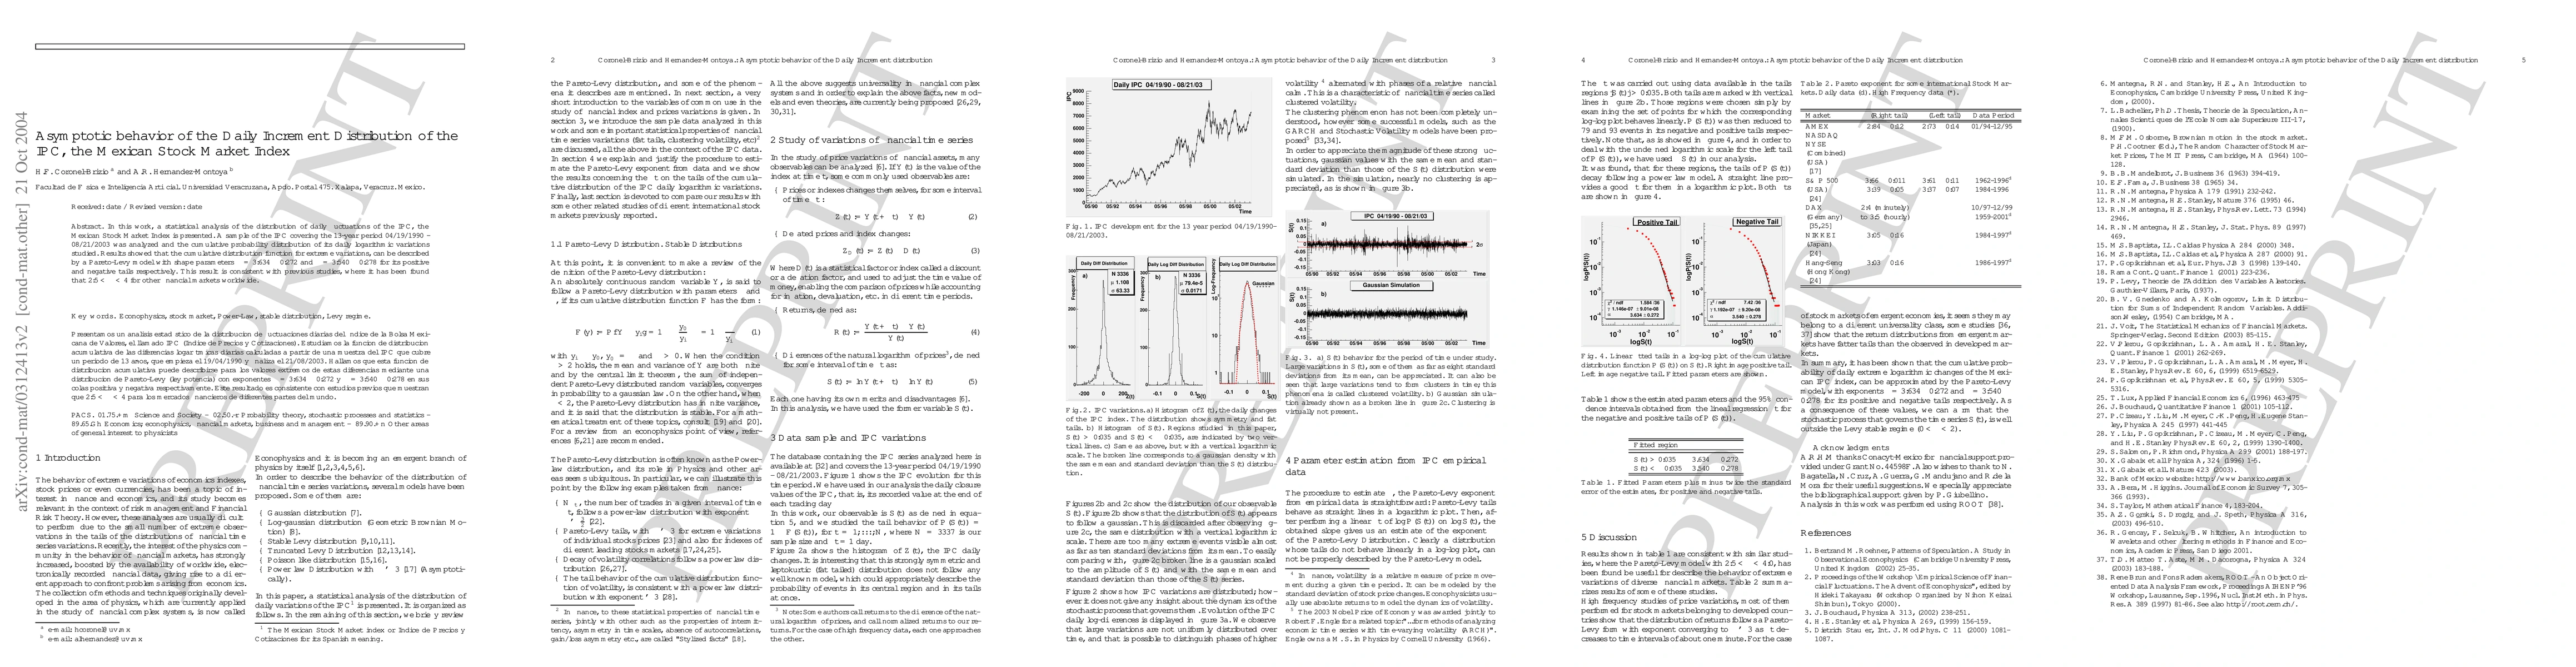
In this work, a statistical analysis of the distribution of daily fluctuations of the IPC, the Mexican Stock Market Index is presented. A sample of the IPC covering the 13-year period 04/19/1990 - 08/21/2003 was analyzed and the cumulative probability distribution of its daily logarithmic variations studied. Results showed that the cumulative distribution function for extreme variations, can be described by a Pareto-Levy model with shape parameters alpha=3.634 +- 0.272 and alpha=3.540 +- 0.278 for its positive and negative tails respectively. This result is consistent with previous studies, where it has been found that 2.5< alpha <4 for other financial markets worldwide.
AI Key Findings
Get AI-generated insights about this paper's methodology, results, and significance.
Comments (0)