At a Glance: Pixel Approximate Entropy as a Measure of Line Chart Complexity
Publication
Metrics
Paper Preview
Abstract
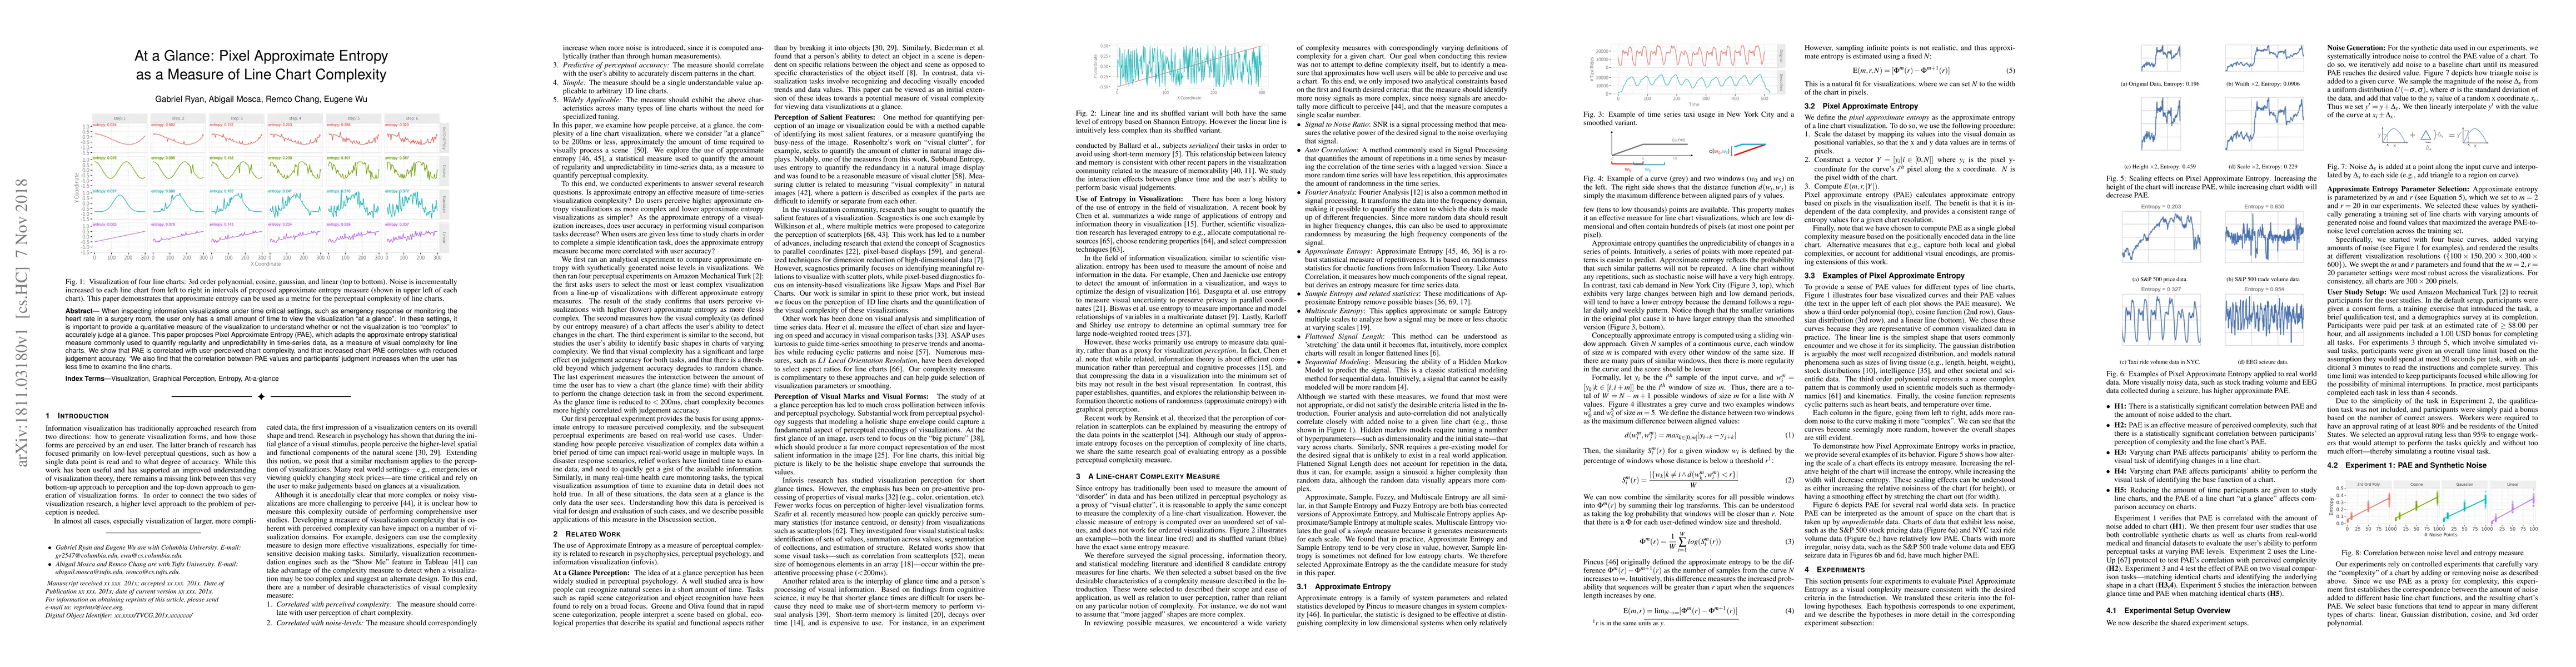
When inspecting information visualizations under time critical settings, such as emergency response or monitoring the heart rate in a surgery room, the user only has a small amount of time to view the visualization "at a glance". In these settings, it is important to provide a quantitative measure of the visualization to understand whether or not the visualization is too "complex" to accurately judge at a glance. This paper proposes Pixel Approximate Entropy (PAE), which adapts the approximate entropy statistical measure commonly used to quantify regularity and unpredictability in time-series data, as a measure of visual complexity for line charts. We show that PAE is correlated with user-perceived chart complexity, and that increased chart PAE correlates with reduced judgement accuracy. We also find that the correlation between PAE values and participants' judgment increases when the user has less time to examine the line charts.
AI Key Findings
Get AI-generated insights about this paper's methodology, results, significance, and more — seven facets brought into focus.
Impact
Paper Details
PDF Preview
Key Terms
Citation Network
Current paper (gray), citations (green), references (blue)
Display is limited for performance on very large graphs.
Discussion 0