Summary
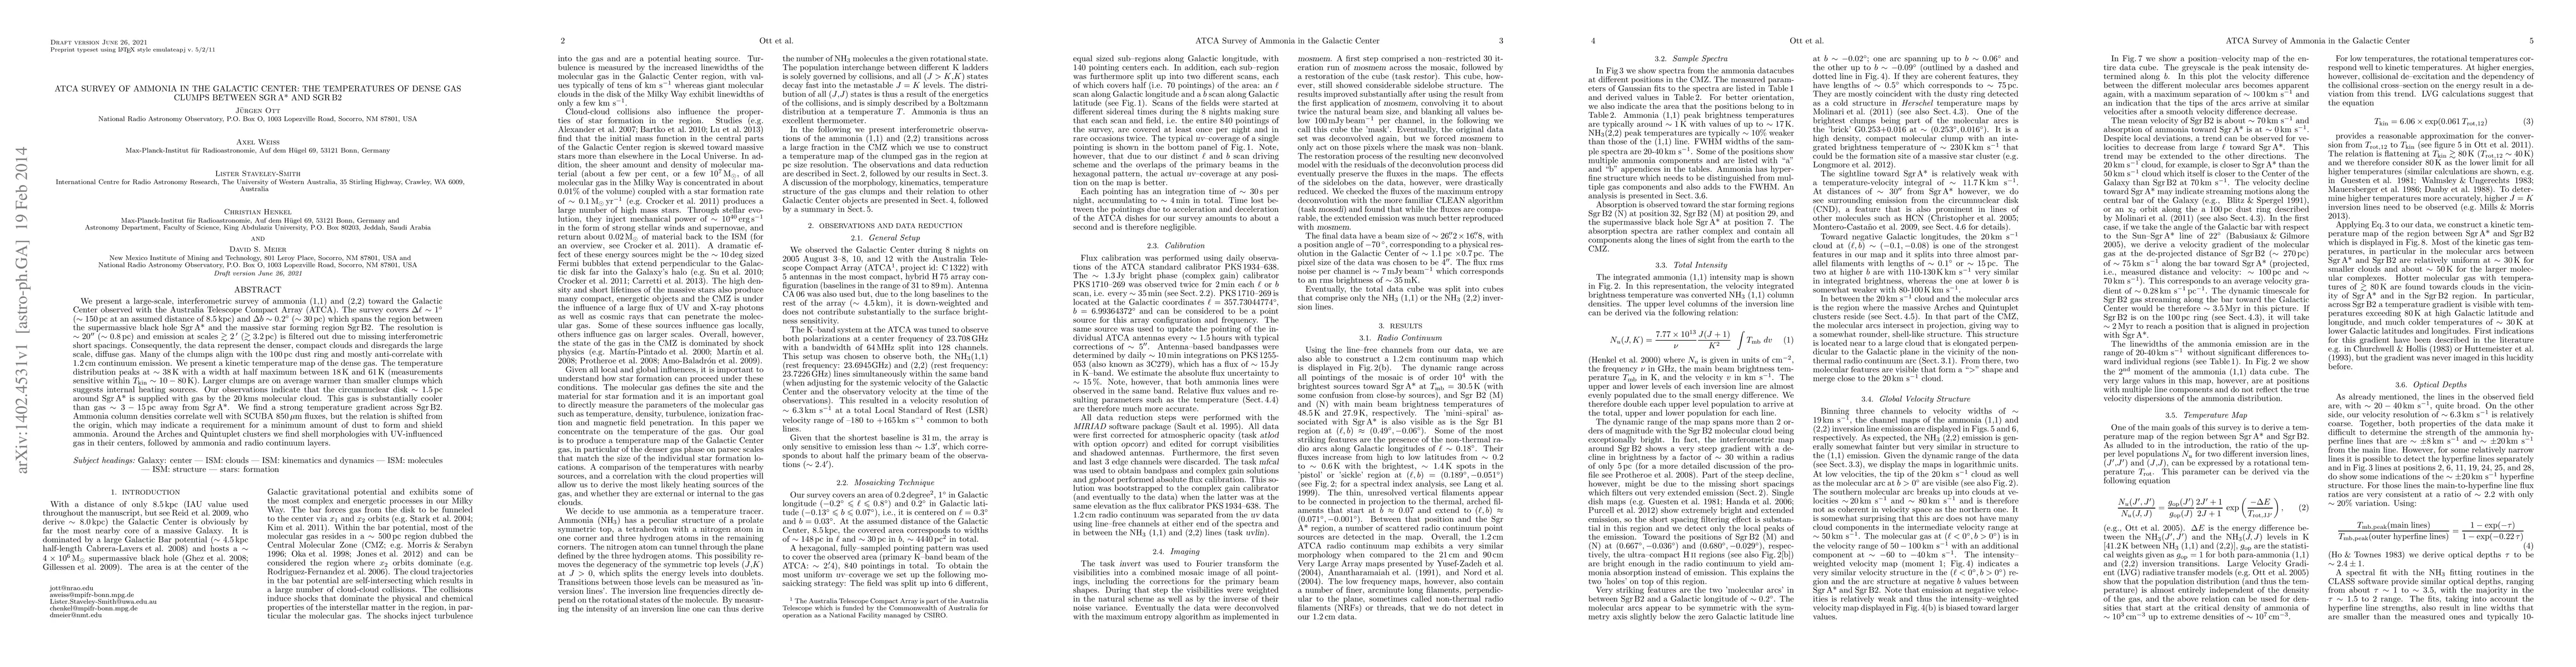
We present a large-scale, interferometric survey of ammonia (1,1) and (2,2) toward the Galactic Center observed with the Australia Telescope Compact Array (ATCA). The survey covers Delta l ~1degree (~150pc) at an assumed distance of 8.5 kpc) and Delta b ~0.2degree (~30pc) which spans the region between the supermassive black hole SgrA* and the massive star forming region SgrB2. The resolution is ~20'' (~0.8pc) and emission at scales >~2' (>~3.2pc) is filtered out due to missing interferometric short spacings. Consequently, the data represent the denser, compact clouds and disregards the large scale, diffuse gas. Many of the clumps align with the 100 pc dust ring and mostly anti-correlate with 1.2cm continuum emission. We present a kinetic temperature map of the dense gas. The temperature distribution peaks at ~38K with a width at half maximum between 18K and 61K (measurements sensitive within Tkin~10-80K). Larger clumps are on average warmer than smaller clumps which suggests internal heating sources. Our observations indicate that the circumnuclear disk ~1.5 pc around SgrA* is supplied with gas by the 20km/s molecular cloud. This gas is substantially cooler than gas ~3-15pc away from SgrA*. We find a strong temperature gradient across SgrB2. Ammonia column densities correlate well with SCUBA 850um fluxes, but the relation is shifted from the origin, which may indicate a requirement for a minimum amount of dust to form and shield ammonia. Around the Arches and Quintuplet clusters we find shell morphologies with UV-influenced gas in their centers, followed by ammonia and radio continuum layers.
AI Key Findings
Get AI-generated insights about this paper's methodology, results, and significance.
Paper Details
PDF Preview
Key Terms
Citation Network
Current paper (gray), citations (green), references (blue)
Display is limited for performance on very large graphs.
Similar Papers
Found 4 papers| Title | Authors | Year | Actions |
|---|
Comments (0)