Atom-specific persistent homology and its application to protein flexibility analysis
Publication
Metrics
AI Quick Summary
This paper introduces atom-specific persistent homology to analyze protein flexibility by creating localized topological representations of individual atoms. The method uses machine learning algorithms to predict B factors, demonstrating its effectiveness in capturing localized molecular dynamics.
Paper Preview
Abstract
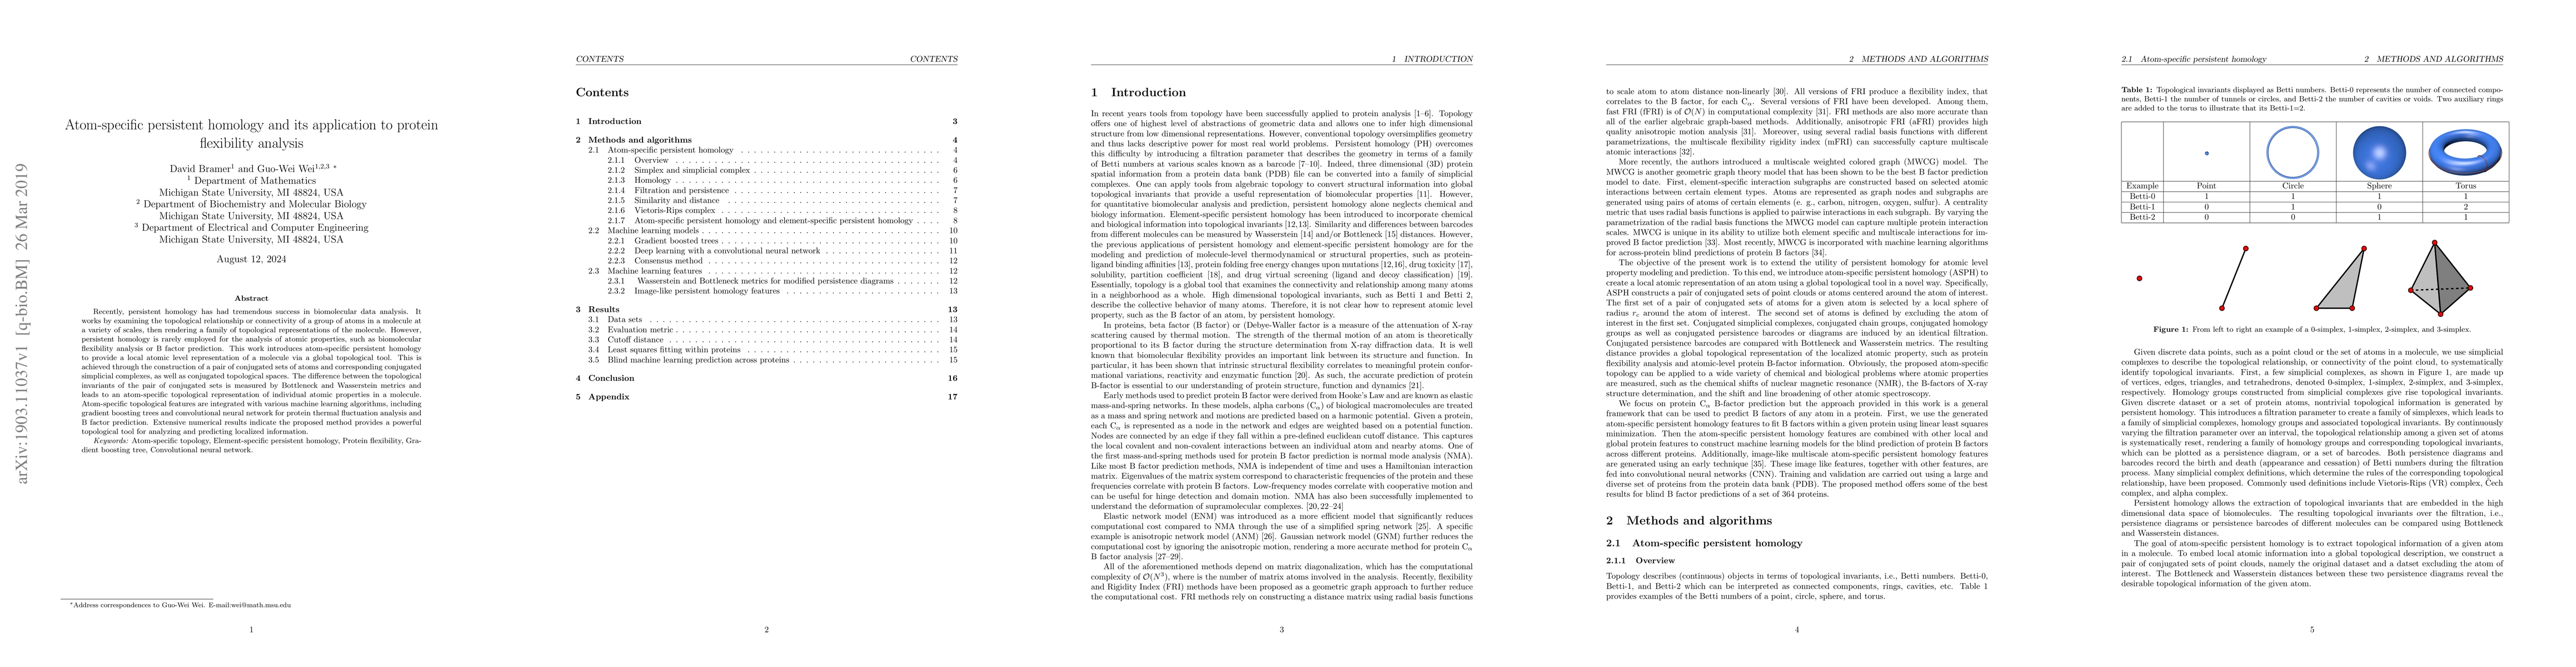
Recently, persistent homology has had tremendous success in biomolecular data analysis. It works by examining the topological relationship or connectivity of a group of atoms in a molecule at a variety of scales, then rendering a family of topological representations of the molecule. However, persistent homology is rarely {employed} for the analysis of atomic properties, such as biomolecular flexibility analysis or B factor prediction. This work introduces atom-specific persistent homology to provide a local atomic level representation of a molecule via a global topological tool. This is achieved through the construction of a pair of conjugated sets of atoms and corresponding conjugated simplicial complexes, as well as conjugated topological spaces. The difference between the topological invariants of the pair of conjugated sets is measured by Bottleneck and Wasserstein metrics and leads to an atom-specific topological representation of individual atomic properties in a molecule. Atom-specific topological features are integrated with various machine learning algorithms, including gradient boosting trees and convolutional neural network for protein thermal fluctuation analysis and B factor prediction. Extensive numerical results indicate the proposed method provides a powerful topological tool for analyzing and predicting localized information.
AI Key Findings
Get AI-generated insights about this paper's methodology, results, significance, and more — seven facets brought into focus.
Impact
Paper Details
PDF Preview
Key Terms
Citation Network
Current paper (gray), citations (green), references (blue)
Display is limited for performance on very large graphs.
Discussion 0