Publication
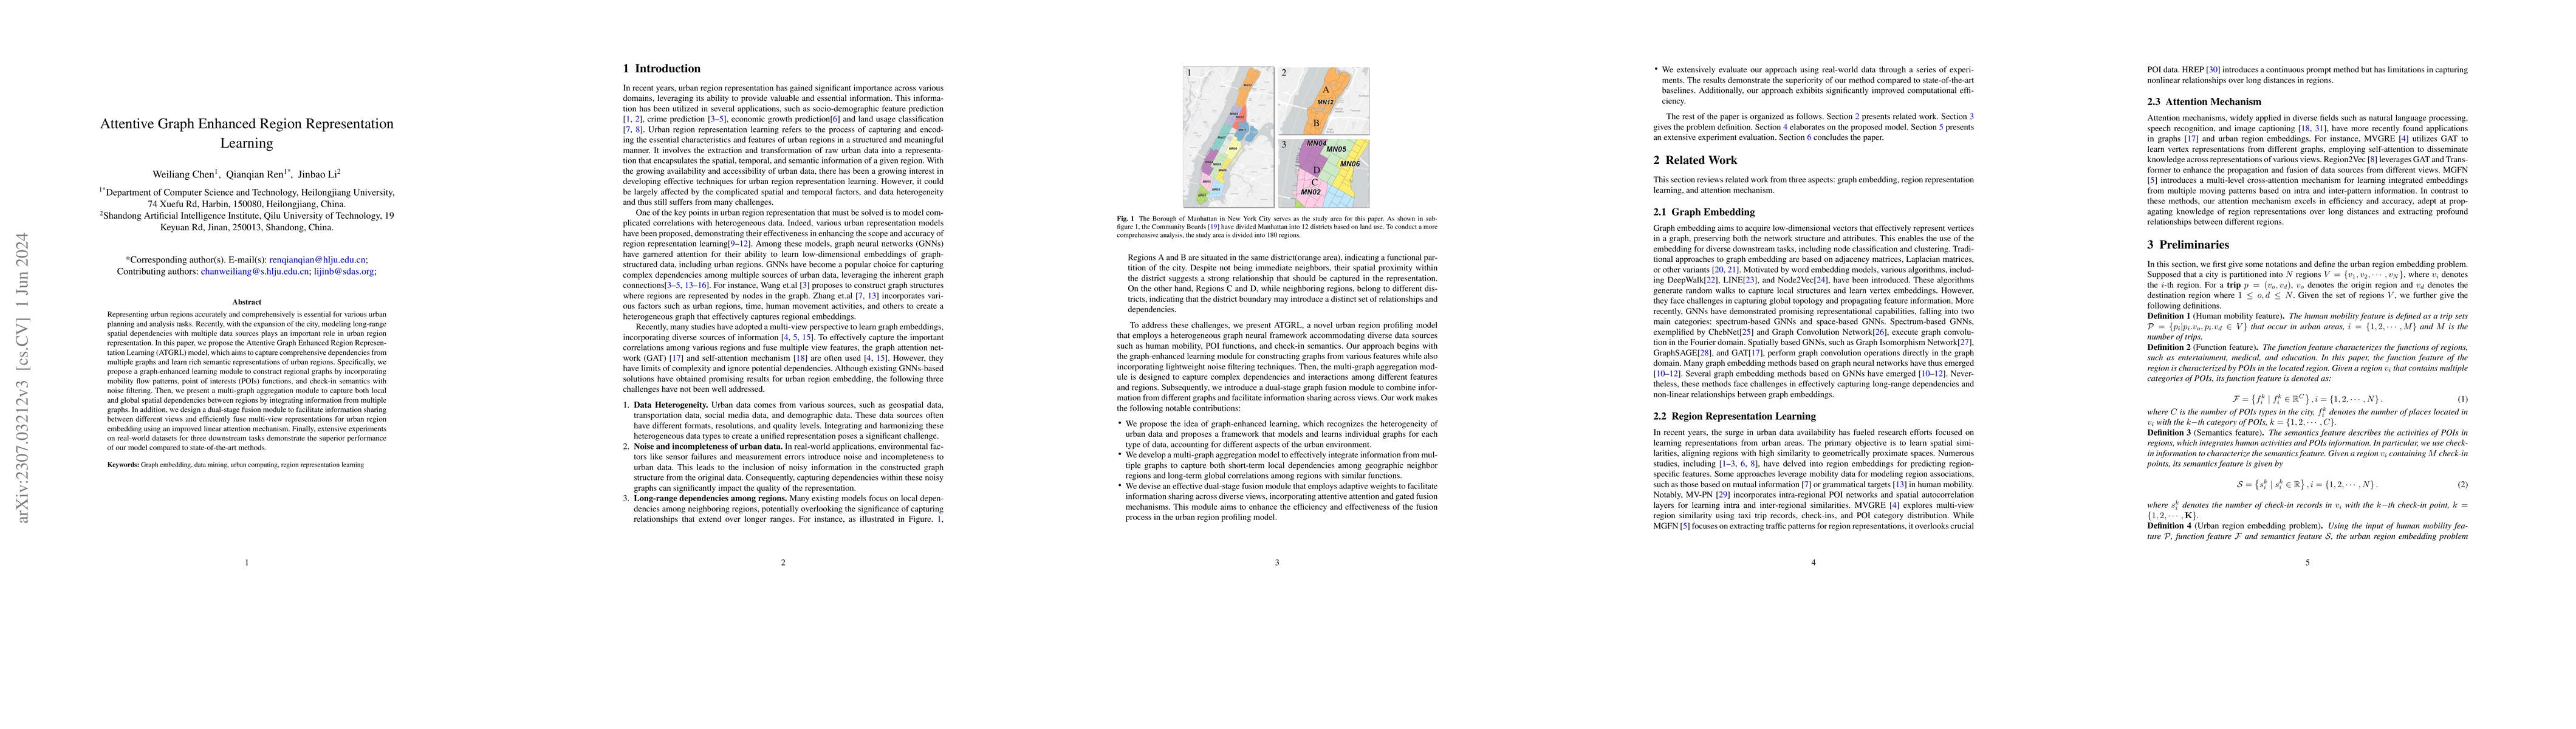
Metrics
AI Quick Summary
The paper proposes the Attentive Graph Enhanced Region Representation Learning (ATGRL) model to capture comprehensive spatial dependencies and learn rich semantic representations of urban regions by integrating multiple data sources and employing graph-enhanced learning, multi-graph aggregation, and dual-stage fusion modules. The model achieves superior performance in urban planning and analysis tasks compared to existing methods.
Paper Preview
Abstract
Representing urban regions accurately and comprehensively is essential for various urban planning and analysis tasks. Recently, with the expansion of the city, modeling long-range spatial dependencies with multiple data sources plays an important role in urban region representation. In this paper, we propose the Attentive Graph Enhanced Region Representation Learning (ATGRL) model, which aims to capture comprehensive dependencies from multiple graphs and learn rich semantic representations of urban regions. Specifically, we propose a graph-enhanced learning module to construct regional graphs by incorporating mobility flow patterns, point of interests (POIs) functions, and check-in semantics with noise filtering. Then, we present a multi-graph aggregation module to capture both local and global spatial dependencies between regions by integrating information from multiple graphs. In addition, we design a dual-stage fusion module to facilitate information sharing between different views and efficiently fuse multi-view representations for urban region embedding using an improved linear attention mechanism. Finally, extensive experiments on real-world datasets for three downstream tasks demonstrate the superior performance of our model compared to state-of-the-art methods.
AI Key Findings
Get AI-generated insights about this paper's methodology, results, significance, and more — seven facets brought into focus.
Impact
Paper Details
Authors
PDF Preview
Key Terms
Citation Network
Current paper (gray), citations (green), references (blue)
Display is limited for performance on very large graphs.
Discussion 0