Attraction-Repulsion Swarming: A Generalized Framework of t-SNE via Force Normalization and Tunable Interactions
Publication
Metrics
AI Quick Summary
This paper introduces Attraction-Repulsion Swarming (ARS) visualization, a novel framework generalizing t-SNE by modeling data points as swarming agents influenced by attraction and repulsion forces. ARS employs force normalization and tunable interaction kernels for improved visualization, avoiding the optimization complexities of t-SNE.
Paper Preview
Abstract
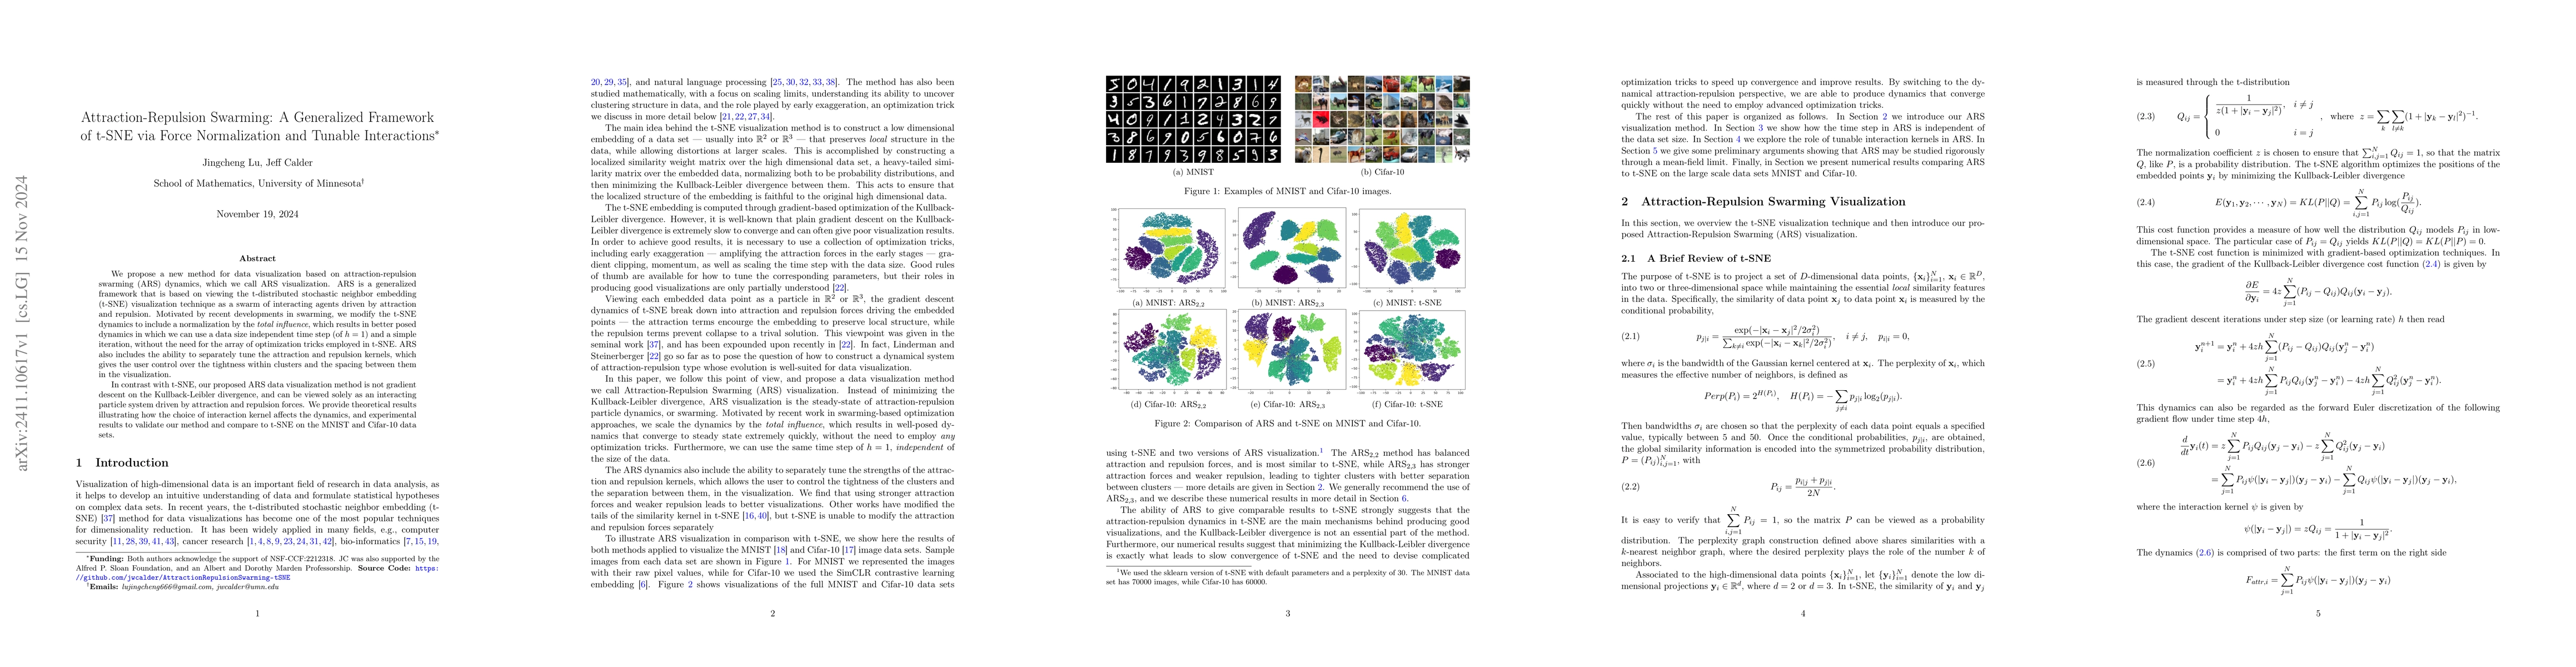
We propose a new method for data visualization based on attraction-repulsion swarming (ARS) dynamics, which we call ARS visualization. ARS is a generalized framework that is based on viewing the t-distributed stochastic neighbor embedding (t-SNE) visualization technique as a swarm of interacting agents driven by attraction and repulsion. Motivated by recent developments in swarming, we modify the t-SNE dynamics to include a normalization by the \emph{total influence}, which results in better posed dynamics in which we can use a data size independent time step (of $h=1$) and a simple iteration, without the need for the array of optimization tricks employed in t-SNE. ARS also includes the ability to separately tune the attraction and repulsion kernels, which gives the user control over the tightness within clusters and the spacing between them in the visualization. In contrast with t-SNE, our proposed ARS data visualization method is not gradient descent on the Kullback-Leibler divergence, and can be viewed solely as an interacting particle system driven by attraction and repulsion forces. We provide theoretical results illustrating how the choice of interaction kernel affects the dynamics, and experimental results to validate our method and compare to t-SNE on the MNIST and Cifar-10 data sets.
AI Key Findings
Get AI-generated insights about this paper's methodology, results, significance, and more — seven facets brought into focus.
Impact
Paper Details
Authors
PDF Preview
Citation Network
Current paper (gray), citations (green), references (blue)
Display is limited for performance on very large graphs.
Discussion 0