Augmenting Decision Making via Interactive What-If Analysis
Publication
Metrics
AI Quick Summary
A new system called SystemD helps business users analyze data more efficiently by allowing them to ask 'what-if' questions and interactively explore relationships between data attributes.
Paper Preview
Abstract
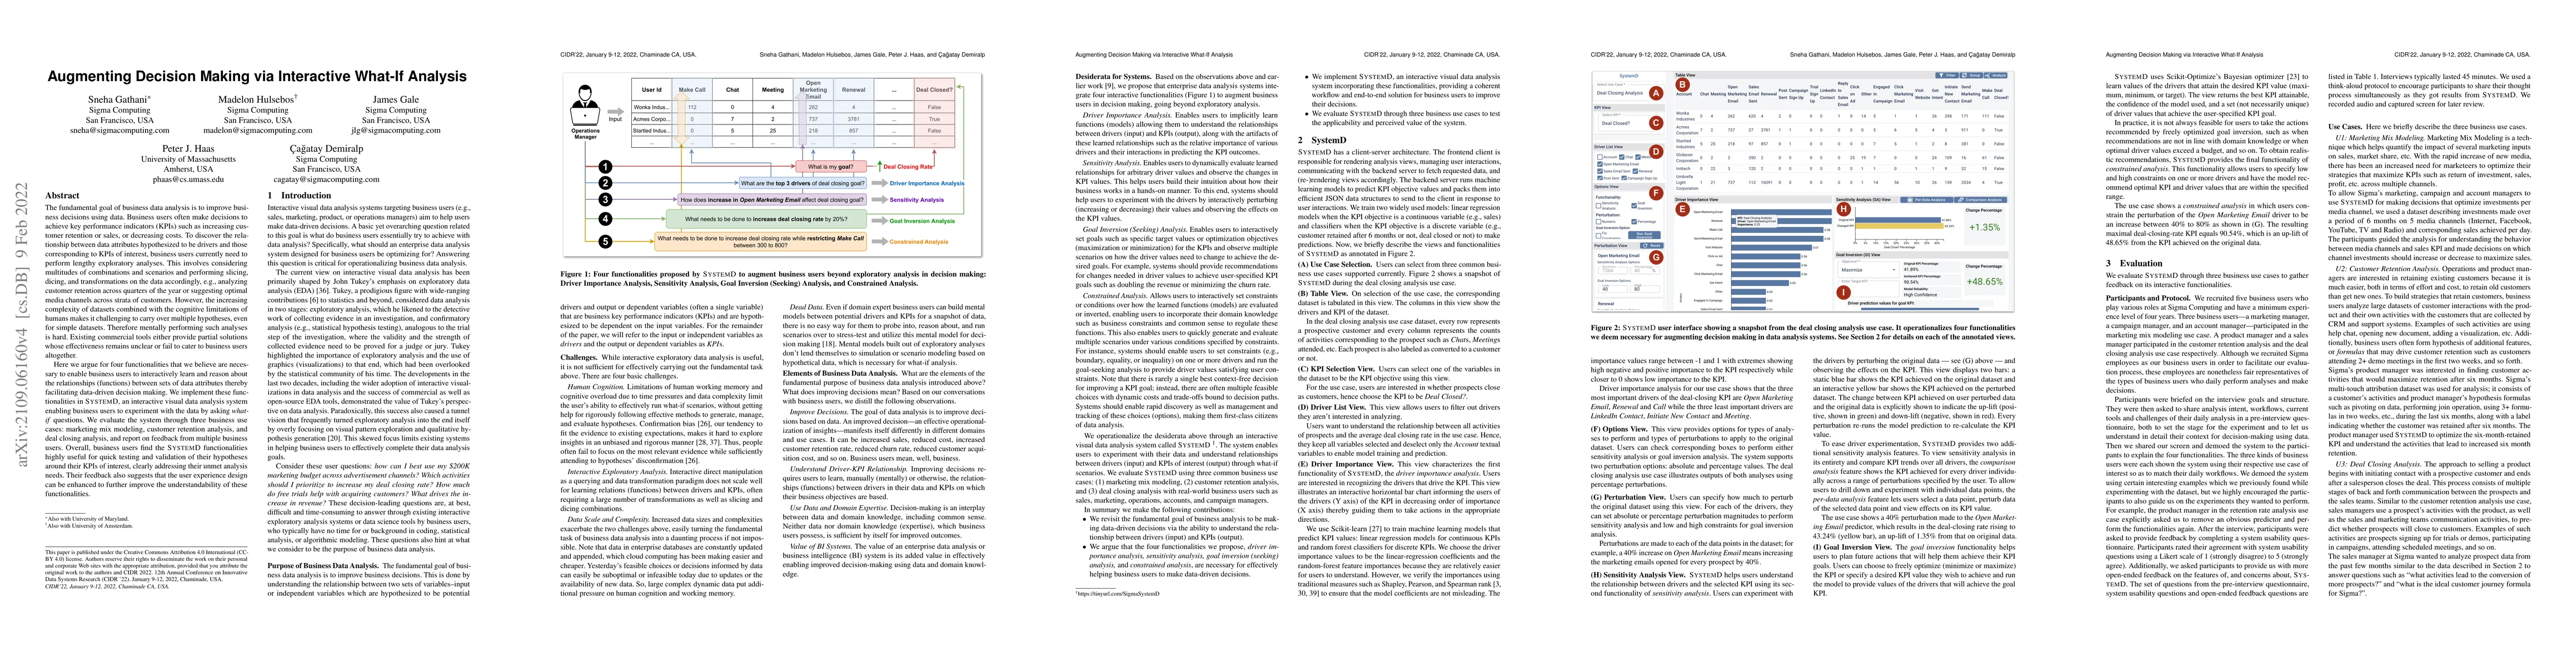
The fundamental goal of business data analysis is to improve business decisions using data. Business users often make decisions to achieve key performance indicators (KPIs) such as increasing customer retention or sales, or decreasing costs. To discover the relationship between data attributes hypothesized to be drivers and those corresponding to KPIs of interest, business users currently need to perform lengthy exploratory analyses. This involves considering multitudes of combinations and scenarios and performing slicing, dicing, and transformations on the data accordingly, e.g., analyzing customer retention across quarters of the year or suggesting optimal media channels across strata of customers. However, the increasing complexity of datasets combined with the cognitive limitations of humans makes it challenging to carry over multiple hypotheses, even for simple datasets. Therefore mentally performing such analyses is hard. Existing commercial tools either provide partial solutions or fail to cater to business users altogether. Here we argue for four functionalities to enable business users to interactively learn and reason about the relationships between sets of data attributes thereby facilitating data-driven decision making. We implement these functionalities in SystemD, an interactive visual data analysis system enabling business users to experiment with the data by asking what-if questions. We evaluate the system through three business use cases: marketing mix modeling, customer retention analysis, and deal closing analysis, and report on feedback from multiple business users. Users find the SystemD functionalities highly useful for quick testing and validation of their hypotheses around their KPIs of interest, addressing their unmet analysis needs. The feedback also suggests that the UX design can be enhanced to further improve the understandability of these functionalities.
AI Key Findings
Get AI-generated insights about this paper's methodology, results, significance, and more — seven facets brought into focus.
Impact
Paper Details
Authors
PDF Preview
Key Terms
Citation Network
Current paper (gray), citations (green), references (blue)
Display is limited for performance on very large graphs.
Discussion 0