Summary
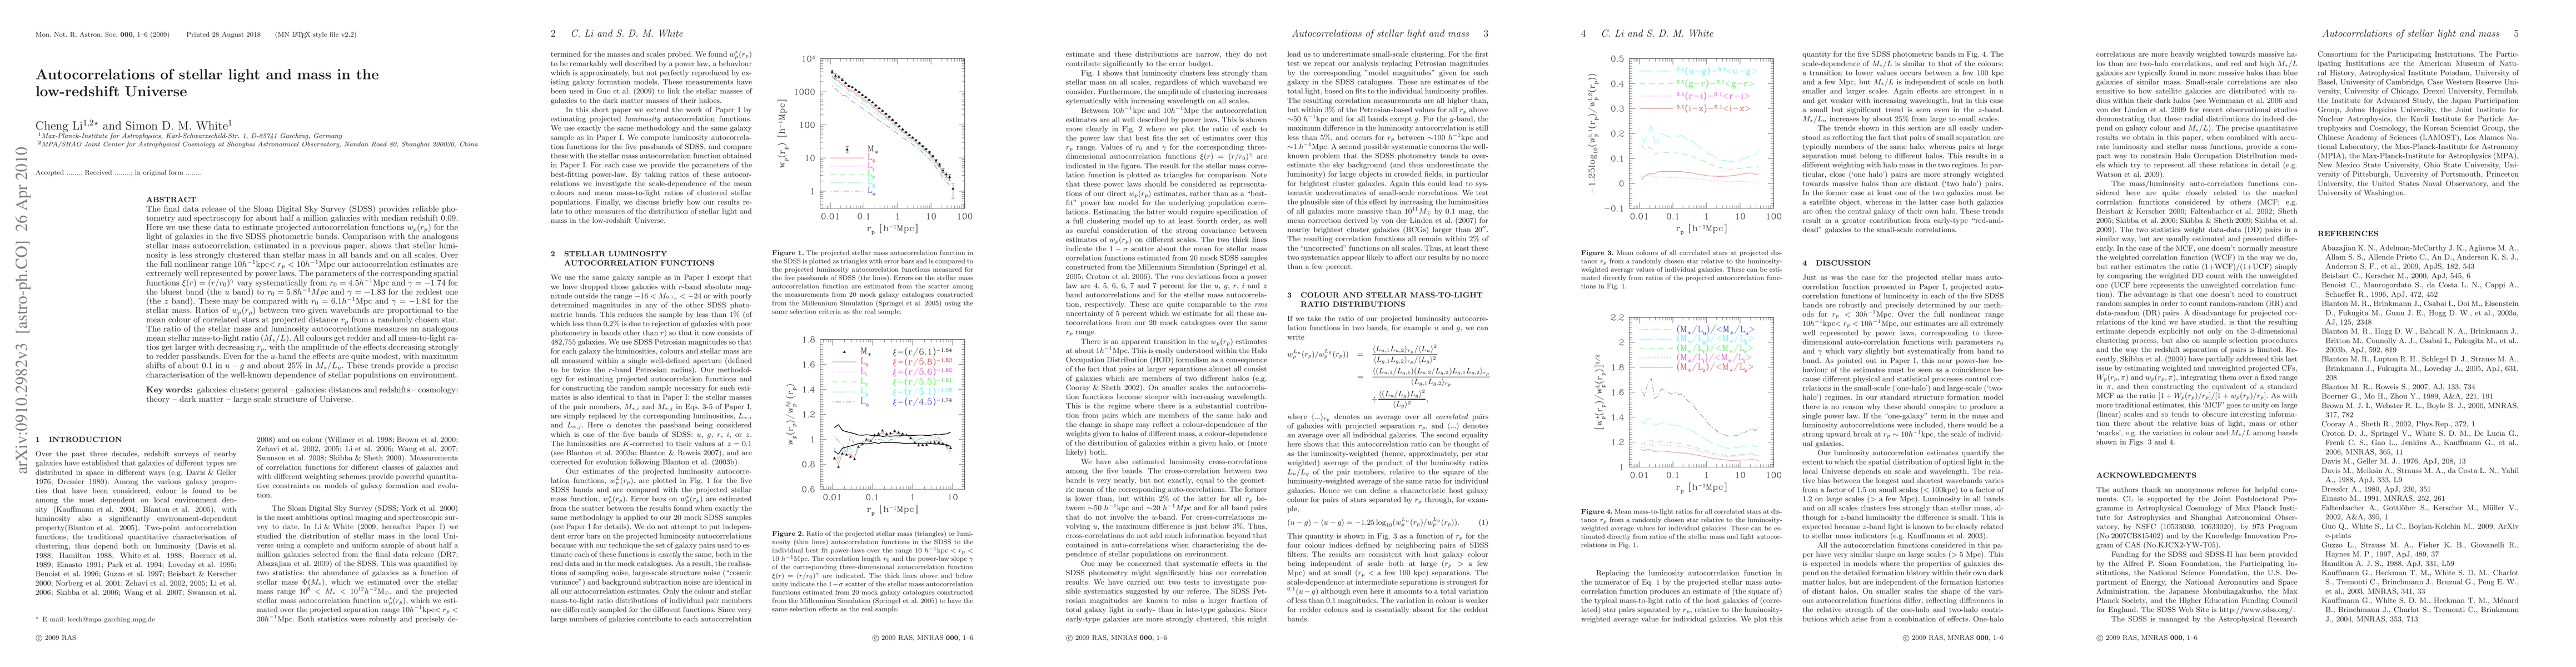
The final data release of the Sloan Digital Sky Survey (SDSS) provides reliable photometry and spectroscopy for about half a million galaxies with median redshift 0.09. Here we use these data to estimate projected autocorrelation functions w_p(r_p) for the light of galaxies in the five SDSS photometric bands. Comparison with the analogous stellar mass autocorrelation, estimated in a previous paper, shows that stellar luminosity is less strongly clustered than stellar mass in all bands and on all scales. Over the full nonlinear range 10 kpc/h < r_p < 10 Mpc/h our autocorrelation estimates are extremely well represented by power laws. The parameters of the corresponding spatial functions \xi(r) = (r/r_0)^\gamma vary systematically from r_0=4.5 Mpc/h and \gamma=-1.74 for the bluest band (the u band) to r_0=5.8 Mpc/h and \gamma=-1.83 for the reddest one (the z band). These may be compared with r_0=6.1 Mpc/h and \gamma=-1.84 for the stellar mass. Ratios of w_p(r_p) between two given wavebands are proportional to the mean colour of correlated stars at projected distance r_p from a randomly chosen star. The ratio of the stellar mass and luminosity autocorrelations measures an analogous mean stellar mass-to-light ratio (M*/L). All colours get redder and all mass-to-light ratios get larger with decreasing r_p, with the amplitude of the effects decreasing strongly to redder passbands. Even for the u-band the effects are quite modest, with maximum shifts of about 0.1 in u-g and about 25% in M*/L_u. These trends provide a precise characterisation of the well-known dependence of stellar populations on environment.
AI Key Findings
Get AI-generated insights about this paper's methodology, results, and significance.
Paper Details
PDF Preview
Key Terms
Citation Network
Current paper (gray), citations (green), references (blue)
Display is limited for performance on very large graphs.
| Title | Authors | Year | Actions |
|---|
Comments (0)