AutoLegend employs online learning and user feedback to generate interactive visualization legends, adapting through a search agent, feedback model, and adversarial loss model. User studies indicate AutoLegend effectively learns user preferences and improves legend accuracy and interaction.
No key terms available for this paper.
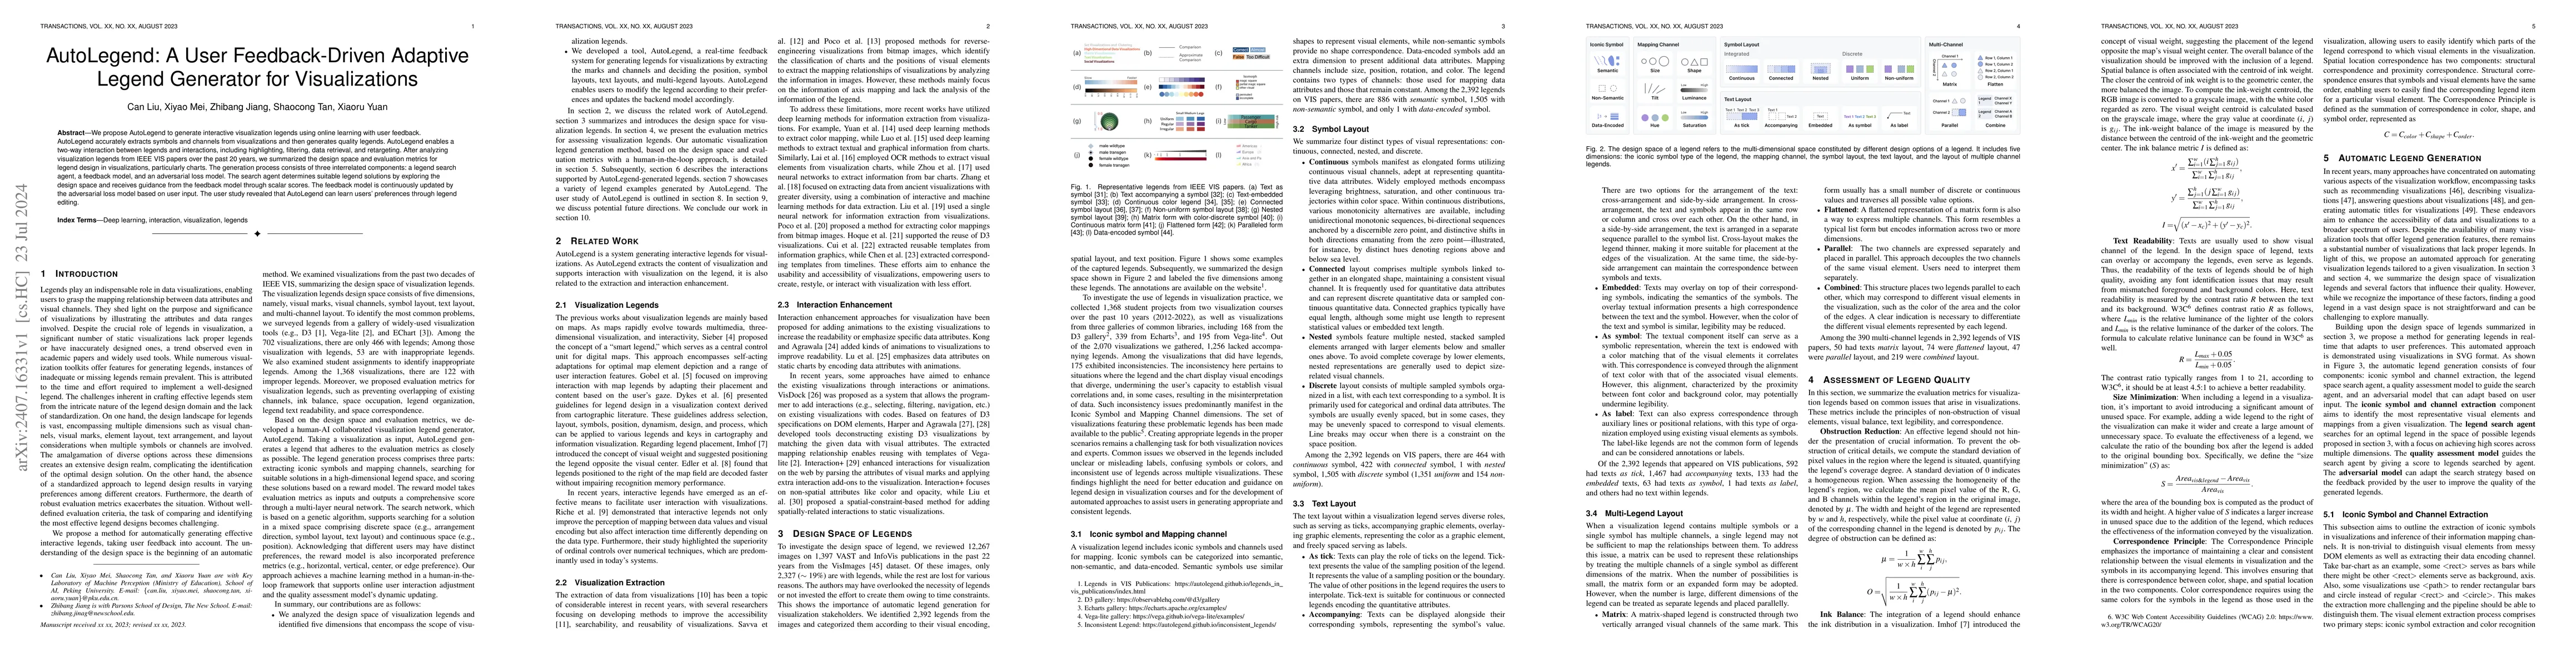
We propose AutoLegend to generate interactive visualization legends using online learning with user feedback. AutoLegend accurately extracts symbols and channels from visualizations and then generates quality legends. AutoLegend enables a two-way interaction between legends and interactions, including highlighting, filtering, data retrieval, and retargeting. After analyzing visualization legends from IEEE VIS papers over the past 20 years, we summarized the design space and evaluation metrics for legend design in visualizations, particularly charts. The generation process consists of three interrelated components: a legend search agent, a feedback model, and an adversarial loss model. The search agent determines suitable legend solutions by exploring the design space and receives guidance from the feedback model through scalar scores. The feedback model is continuously updated by the adversarial loss model based on user input. The user study revealed that AutoLegend can learn users' preferences through legend editing.
This graph shows how this paper is connected to other research. The current paper is shown in dark gray, papers that cite it are in green, and papers it references are in blue. You can:
• Hover over any node to see the paper title
• Click a node to view that paper's details
• Drag nodes to rearrange the graph
• Use the zoom controls (bottom right) to zoom in/out
No citations found for this paper.
Title | Authors | Year | Actions |
---|---|---|---|
AutoTitle: An Interactive Title Generator for Visualizations
|
Can Liu, Y. Guo, Xiaoru Yuan
|
2023
|
View Paper |
A Spatial Constraint Model for Manipulating Static Visualizations
|
Can Liu, Yu Zhang, Cong Wu, Chen Li, Xiaoru Yuan
|
2023
|
View Paper |
A Mixed-Initiative Approach to Reusing Infographie Charts
|
Weiwei Cui, Jinpeng Wang, He Huang, Yun Wang, Chin-Yew Lin, Haidong Zhang, Dongmei Zhang
|
2021
|
View Paper |
MI3: Machine-initiated Intelligent Interaction for Interactive Classification and Data Reconstruction
|
Zhangyu, CoeckeBob, Chenmin
|
2021
|
View Paper |
PyGAD: An Intuitive Genetic Algorithm Python Library
|
A. Gad
|
2021
|
View Paper |
Deep Colormap Extraction From Visualizations
|
Linping Yuan, Wei Zeng, Siwei Fu, Zhiliang Zeng, Haotian Li, Chi-Wing Fu, Huamin Qu
|
2021
|
View Paper |
ChartOCR: Data Extraction from Charts Images via a Deep Hybrid Framework
|
Junyu Luo, Zekun Li, Jinpeng Wang, Chin-Yew Lin
|
2021
|
View Paper |
Enhancing Static Charts With Data-Driven Animations
|
Min Lu, N. Fish, Shuaiqi Wang, J. Lanir, D. Cohen-Or, Hui Huang
|
2020
|
View Paper |
Reverse-engineering bar charts using neural networks
|
Fangfang Zhou, Yong Zhao, Wenjiang Chen, Yijing Tan, Yaqi Xu, Yi Chen, Chao Liu, Ying Zhao
|
2020
|
View Paper |
VisImages: A Fine-Grained Expert-Annotated Visualization Dataset
|
Dazhen Deng, Yihong Wu, Xinhuan Shu, Jiang Wu, Siwei Fu, Weiwei Cui, Yingnian Wu
|
2020
|
View Paper |
AutoCaption: An Approach to Generate Natural Language Description from Visualization Automatically
|
Can Liu, Liwenhan Xie, Yun Han, Datong Wei, Xiaoru Yuan
|
2020
|
View Paper |
Automatic Annotation Synchronizing with Textual Description for Visualization
|
Chufan Lai, Zhixian Lin, Ruike Jiang, Yun Han, Can Liu, Xiaoru Yuan
|
2020
|
View Paper |
Many-to-Many Geographically-Embedded Flow Visualisation: An Evaluation
|
Yalong Yang, Tim Dwyer, Sarah Goodwin, K. Marriott
|
2019
|
View Paper |
Towards Automated Infographic Design: Deep Learning-based Auto-Extraction of Extensible Timeline
|
Zhutian Chen, Yun Wang, Qianwen Wang, Yong Wang, Huamin Qu
|
2019
|
View Paper |
Searching the Visual Style and Structure of D3 Visualizations
|
Enamul Hoque, Maneesh Agrawala
|
2019
|
View Paper |
Data Extraction from Charts via Single Deep Neural Network
|
Xiaoyi Liu, D. Klabjan, Patrick N. Bless
|
2019
|
View Paper |
Visualizing for the Non‐Visual: Enabling the Visually Impaired to Use Visualization
|
Jinho Choi, Sanghun Jung, Deok Gun Park, J. Choo, N. Elmqvist
|
2019
|
View Paper |
Searching for the ‘Right’ Legend: The Impact of Legend Position on Legend Decoding in a Cartographic Memory Task
|
Dennis Edler, Julian Keil, Marie-Christin Tuller, A. Bestgen, F. Dickmann
|
2018
|
View Paper |
Vega-Lite: A Grammar of Interactive Graphics
|
Arvind Satyanarayan, Dominik Moritz, Kanit Wongsuphasawat, Jeffrey Heer
|
2018
|
View Paper |
VizML: A Machine Learning Approach to Visualization Recommendation
|
K. Hu, Michiel A. Bakker, Stephen Li, Tim Kraska, César A. Hidalgo
|
2018
|
View Paper |
Genetic Algorithm
|
Seyedali Mirjalili
|
2018
|
View Paper |
Improving map reading with gaze-adaptive legends
|
F. Göbel, P. Kiefer, I. Giannopoulos, A. Duchowski, M. Raubal
|
2018
|
View Paper |
ECharts: A declarative framework for rapid construction of web-based visualization
|
Deqing Li, Honghui Mei, Yi Shen, Shuang Su, Wenli Zhang, Junting Wang, Ming Zu, Wei Chen
|
2018
|
View Paper |
Extracting and Retargeting Color Mappings from Bitmap Images of Visualizations
|
Jorge Poco, Angela Mayhua, Jeffrey Heer
|
2018
|
View Paper |
FigureQA: An Annotated Figure Dataset for Visual Reasoning
|
Samira Ebrahimi Kahou, Adam Atkinson, Vincent Michalski, Ákos Kádár, Adam Trischler, Yoshua Bengio
|
2017
|
View Paper |
Reverse‐Engineering Visualizations: Recovering Visual Encodings from Chart Images
|
Jorge Poco, Jeffrey Heer
|
2017
|
View Paper |
Interaction+: Interaction enhancement for web-based visualizations
|
Min Lu, Jie Liang, Yu Zhang, Guozheng Li, Siming Chen, Zongru Li, Xiaoru Yuan
|
2017
|
View Paper |
Visually Exploring Transportation Schedules
|
Cesar Palomo, Zhan Guo, Cláudio T. Silva, J. Freire
|
2016
|
View Paper |
Exploring Evolving Media Discourse Through Event Cueing
|
Yafeng Lu, Michael Steptoe, Sarah Burke, Hong Wang, J. Tsai, H. Davulcu, D. Montgomery, Steven R. Corman, Ross Maciejewski
|
2016
|
View Paper |
Comparative visual analysis of vector field ensembles
|
M. Jarema, I. Demir, J. Kehrer, R. Westermann
|
2015
|
View Paper |
VisDock: A Toolkit for Cross-Cutting Interactions in Visualization
|
Jungu Choi, Deok Gun Park, Yuet Ling Wong, Eli Raymond Fisher, N. Elmqvist
|
2015
|
View Paper |
Axis Calibration for Improving Data Attribute Estimation in Star Coordinates Plots
|
M. Rubio-Sánchez, Alberto Sánchez
|
2014
|
View Paper |
Deconstructing and restyling D3 visualizations
|
Jonathan Harper, Maneesh Agrawala
|
2014
|
View Paper |
Using Concrete Scales: A Practical Framework for Effective Visual Depiction of Complex Measures
|
Fanny Chevalier, Romain Vuillemot, G. Gali
|
2013
|
View Paper |
Facilitating Discourse Analysis with Interactive Visualization
|
Jian Zhao, Fanny Chevalier, C. Collins, Ravin Balakrishnan
|
2012
|
View Paper |
Graphical Overlays: Using Layered Elements to Aid Chart Reading
|
Nicholas Kong, Maneesh Agrawala
|
2012
|
View Paper |
Design Study of LineSets, a Novel Set Visualization Technique
|
Basak Alper, N. Riche, Gonzalo A. Ramos, M. Czerwinski
|
2011
|
View Paper |
D³ Data-Driven Documents
|
M. Bostock, Vadim Ogievetsky, Jeffrey Heer
|
2011
|
View Paper |
Composite Density Maps for Multivariate Trajectories
|
Roeland Scheepens, N. Willems, H. V. D. Wetering, G. Andrienko, N. Andrienko, J. V. Wijk
|
2011
|
View Paper |
ReVision: automated classification, analysis and redesign of chart images
|
M. Savva, Nicholas Kong, Arti Chhajta, Li Fei-Fei, Maneesh Agrawala, Jeffrey Heer
|
2011
|
View Paper |
Comparing different levels of interaction constraints for deriving visual problem isomorphs
|
Wenwen Dou, Caroline Ziemkiewicz, Lane Harrison, D. Jeong, Roxanne Ryan, W. Ribarsky, Xiaoyu Wang, Remco Chang
|
2010
|
View Paper |
Rethinking Map Legends with Visualization
|
J. Dykes, J. Wood, A. Slingsby
|
2010
|
View Paper |
Visualization of uncertainty and analysis of geographical data
|
J. Wood, A. Slingsby, Naz Khalili-Shavarini, J. Dykes, D. Mountain
|
2009
|
View Paper |
Spatiotemporal Analysis of Sensor Logs using Growth Ring Maps
|
Peter Bak, Florian Mansmann, H. Janetzko, D. Keim
|
2009
|
View Paper |
Scattering Points in Parallel Coordinates
|
Xiaoru Yuan, Peihong Guo, He Xiao, Hong Zhou, Huamin Qu
|
2009
|
View Paper |
Measuring and testing dependence by correlation of distances
|
G. Sz'ekely, Maria L. Rizzo, N. K. Bakirov
|
2007
|
View Paper |
A Density-Based Algorithm for Discovering Clusters in Large Spatial Databases with Noise
|
M. Ester, H. Kriegel, J. Sander, Xiaowei Xu
|
1996
|
View Paper |
Towards Assisting the Visually Impaired: A Review on Techniques for Decoding the Visual Data From Chart Images
|
K. C. Shahira, A. Lijiya
|
2021
|
View Paper |
Small Multiples with Gaps
|
Wouter Meulemans, J. Dykes, A. Slingsby, C. Turkay, J. Wood
|
2017
|
View Paper |
SMART LEGEND SMART ATLAS !
|
R. Sieber, C. Schmid, Samuel Wiesmann
|
2005
|
View Paper |
Thematische Kartographie . Berlin
|
1972
|
||
Eurographics/ Ieee-vgtc Symposium on Visualization 2010 Understanding Interactive Legends: a Comparative Evaluation with Standard Widgets
|
G. Melançon, T. Munzner, D. Weiskopf, N. Riche, Bongshin Lee, C. Plaisant
|
View Paper |
Showing first page preview. Click "Open Full PDF" to view the complete paper.
Published: 2019-12-13
Darshan Gadginmath, Fabio Pasqualetti, Vishaal Krishnan
Published: 2023-11-08
Published: 2021-02-11
Published: 2021-03-10
You need to log in to post a comment.
Your comment contains inappropriate language.
Are you sure you want to remove this tag?
Someone just favorited a paper!
Comments (0)