Publication
Metrics
AI Quick Summary
This paper introduces an innovative image analysis method to digitize printed electrocardiograms (ECGs) from paper into digital signals, combining graphical information with digital data for enhanced automated diagnosis of arrhythmias and other cardiovascular conditions. The method aims to bridge the gap between traditional analog ECG machines and modern digital diagnostic tools.
Paper Preview
Abstract
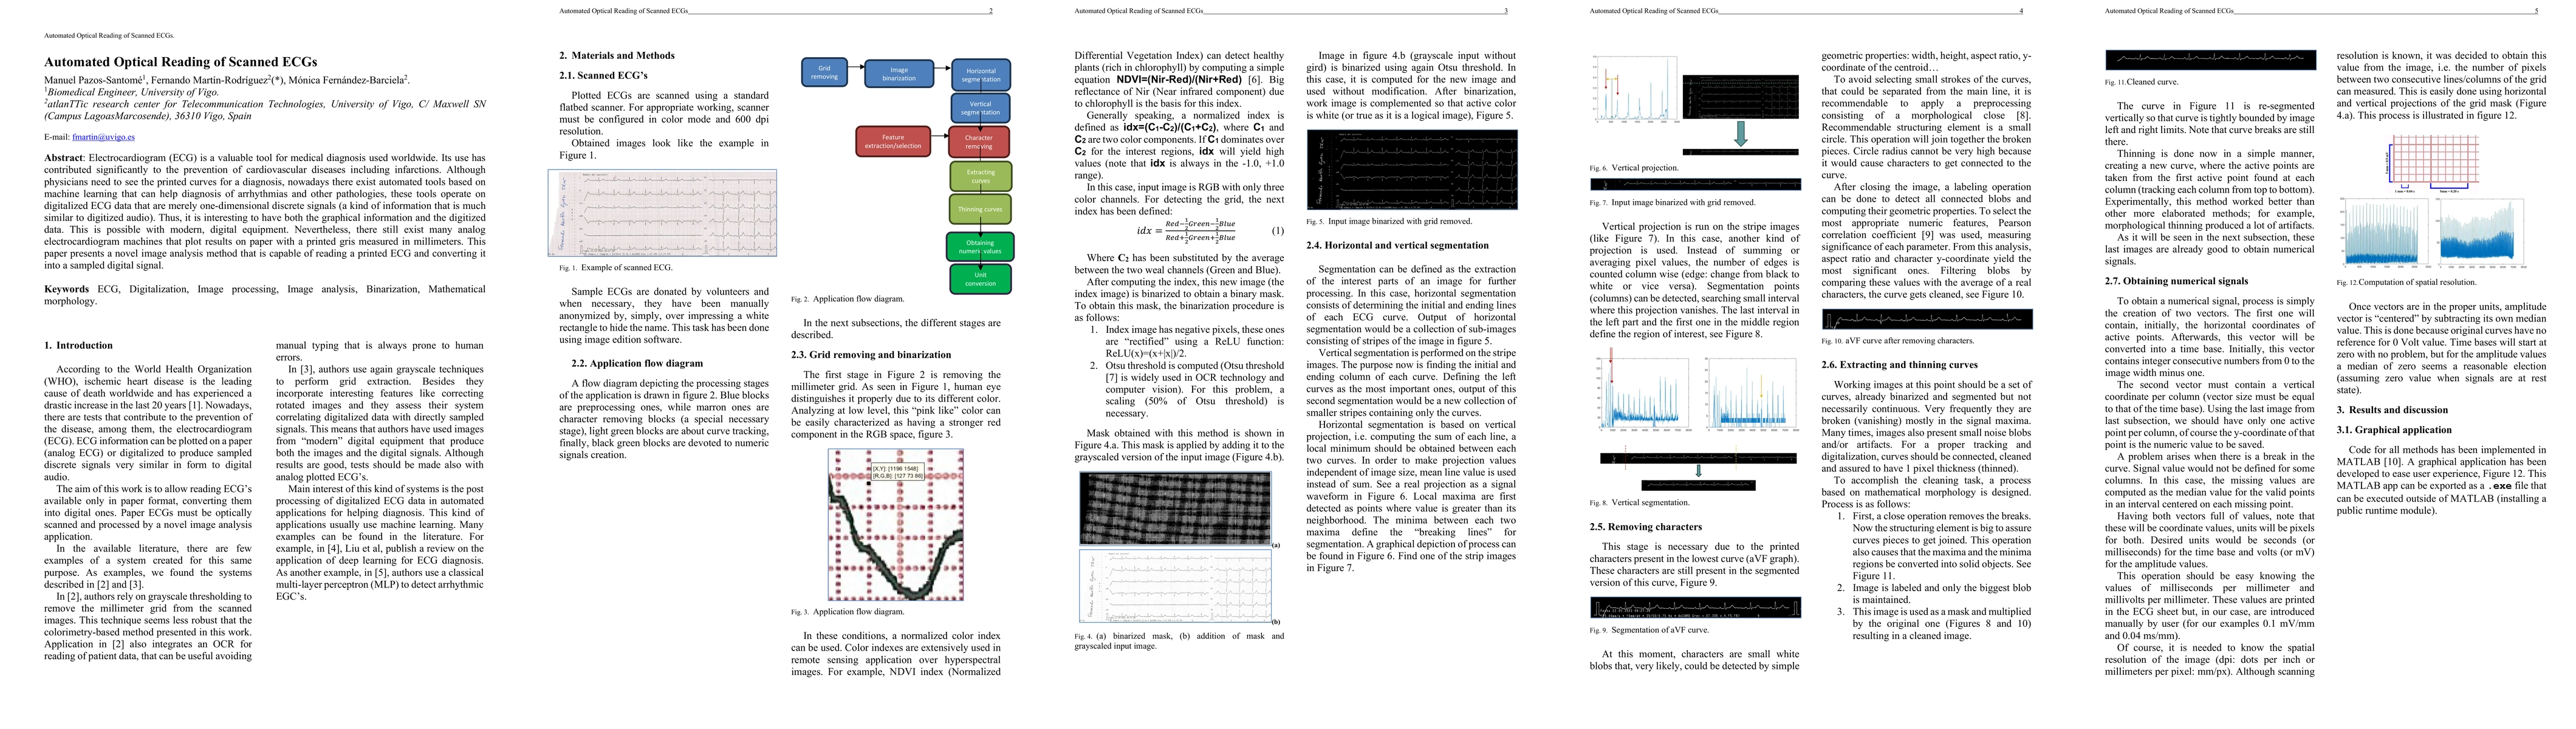
Electrocardiogram (ECG) is a valuable tool for medical diagnosis used worldwide. Its use has contributed significantly to the prevention of cardiovascular diseases including infarctions. Although physicians need to see the printed curves for a diagnosis, nowadays there exist automated tools based on machine learning that can help diagnosis of arrhythmias and other pathologies, these tools operate on digitalized ECG data that are merely one-dimensional discrete signals (a kind of information that is much similar to digitized audio). Thus, it is interesting to have both the graphical information and the digitized data. This is possible with modern, digital equipment. Nevertheless, there still exist many analog electrocardiogram machines that plot results on paper with a printed gris measured in millimeters. This paper presents a novel image analysis method that is capable of reading a printed ECG and converting it into a sampled digital signal.
AI Key Findings
Get AI-generated insights about this paper's methodology, results, significance, and more — seven facets brought into focus.
Impact
Paper Details
Authors
PDF Preview
Citation Network
Current paper (gray), citations (green), references (blue)
Display is limited for performance on very large graphs.
Discussion 0