Automated Quantification of CT Patterns Associated with COVID-19 from Chest CT
Publication
Metrics
AI Quick Summary
This paper presents an automated method using deep learning to segment and quantify COVID-19-related abnormalities in chest CT scans, achieving high correlation with manual annotations and significantly reducing processing time.
Paper Preview
Abstract
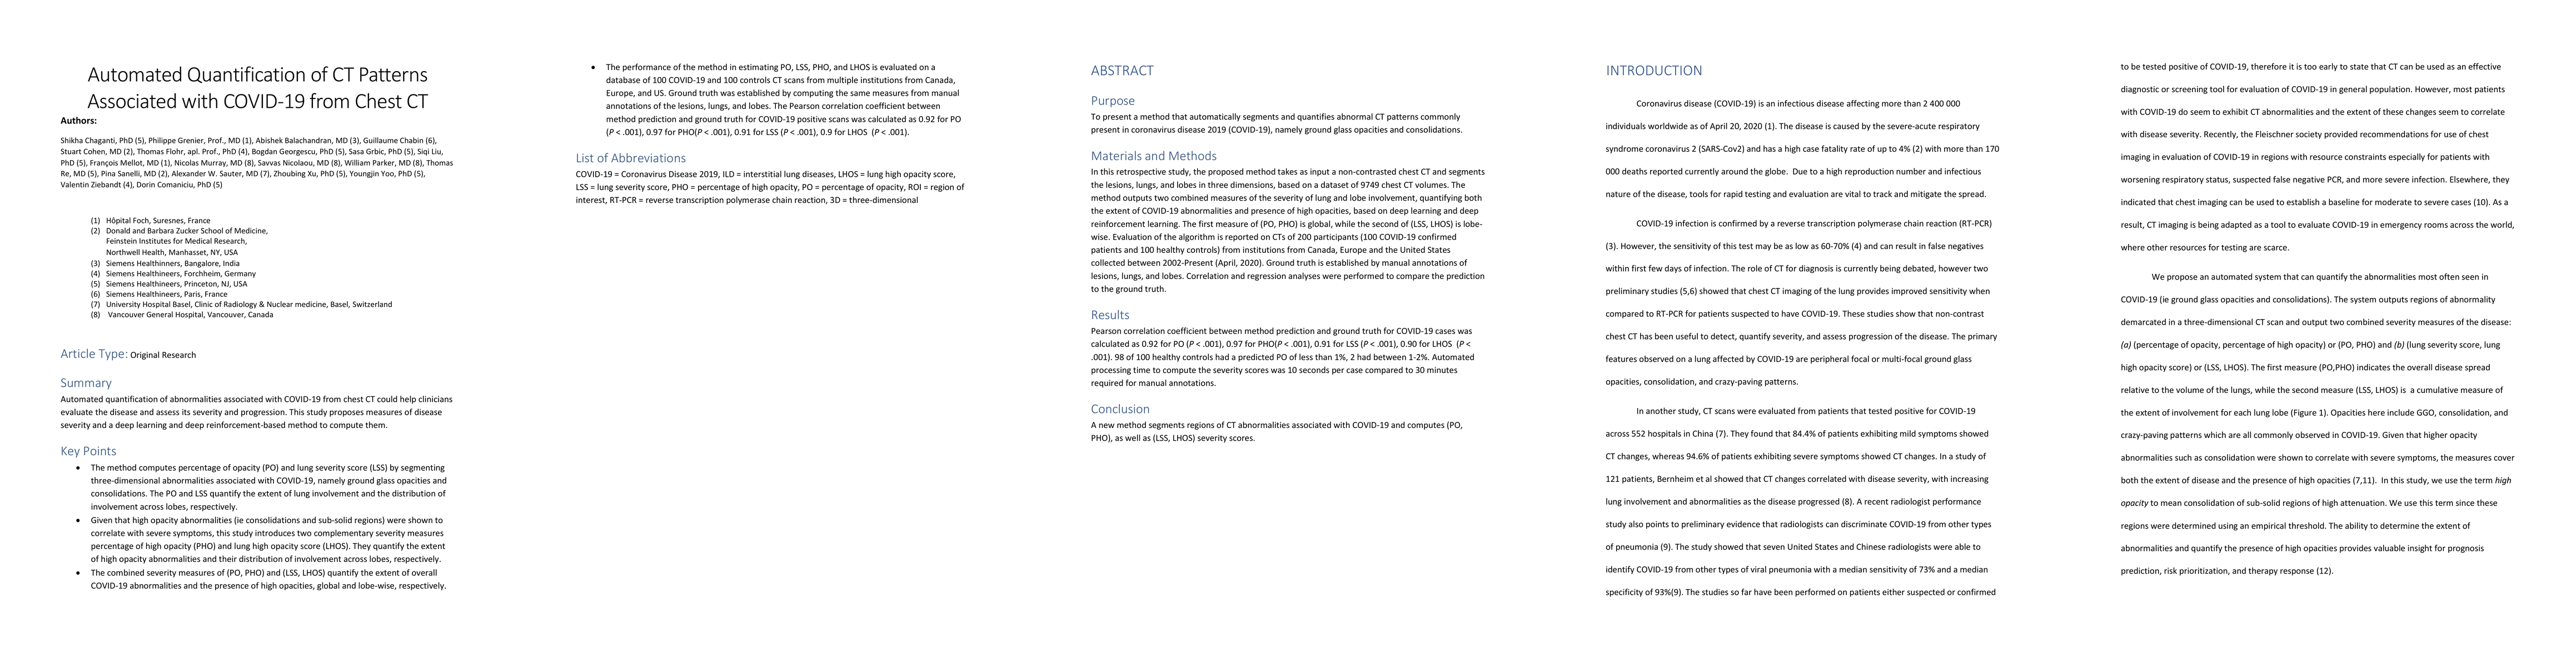
Purpose: To present a method that automatically segments and quantifies abnormal CT patterns commonly present in coronavirus disease 2019 (COVID-19), namely ground glass opacities and consolidations. Materials and Methods: In this retrospective study, the proposed method takes as input a non-contrasted chest CT and segments the lesions, lungs, and lobes in three dimensions, based on a dataset of 9749 chest CT volumes. The method outputs two combined measures of the severity of lung and lobe involvement, quantifying both the extent of COVID-19 abnormalities and presence of high opacities, based on deep learning and deep reinforcement learning. The first measure of (PO, PHO) is global, while the second of (LSS, LHOS) is lobewise. Evaluation of the algorithm is reported on CTs of 200 participants (100 COVID-19 confirmed patients and 100 healthy controls) from institutions from Canada, Europe and the United States collected between 2002-Present (April, 2020). Ground truth is established by manual annotations of lesions, lungs, and lobes. Correlation and regression analyses were performed to compare the prediction to the ground truth. Results: Pearson correlation coefficient between method prediction and ground truth for COVID-19 cases was calculated as 0.92 for PO (P < .001), 0.97 for PHO(P < .001), 0.91 for LSS (P < .001), 0.90 for LHOS (P < .001). 98 of 100 healthy controls had a predicted PO of less than 1%, 2 had between 1-2%. Automated processing time to compute the severity scores was 10 seconds per case compared to 30 minutes required for manual annotations. Conclusion: A new method segments regions of CT abnormalities associated with COVID-19 and computes (PO, PHO), as well as (LSS, LHOS) severity scores.
AI Key Findings
Get AI-generated insights about this paper's methodology, results, significance, and more — seven facets brought into focus.
Impact
Paper Details
PDF Preview
Key Terms
Citation Network
Current paper (gray), citations (green), references (blue)
Display is limited for performance on very large graphs.
Discussion 0