Automated Question Generation on Tabular Data for Conversational Data Exploration
Publication
Metrics
AI Quick Summary
This research proposes a system for automated question generation on tabular data aimed at enhancing conversational data exploration for non-technical users. It leverages a fine-tuned T5 language model to generate natural language questions based on interesting slices of the dataset, which are then recommended in a conversational setting.
Paper Preview
Abstract
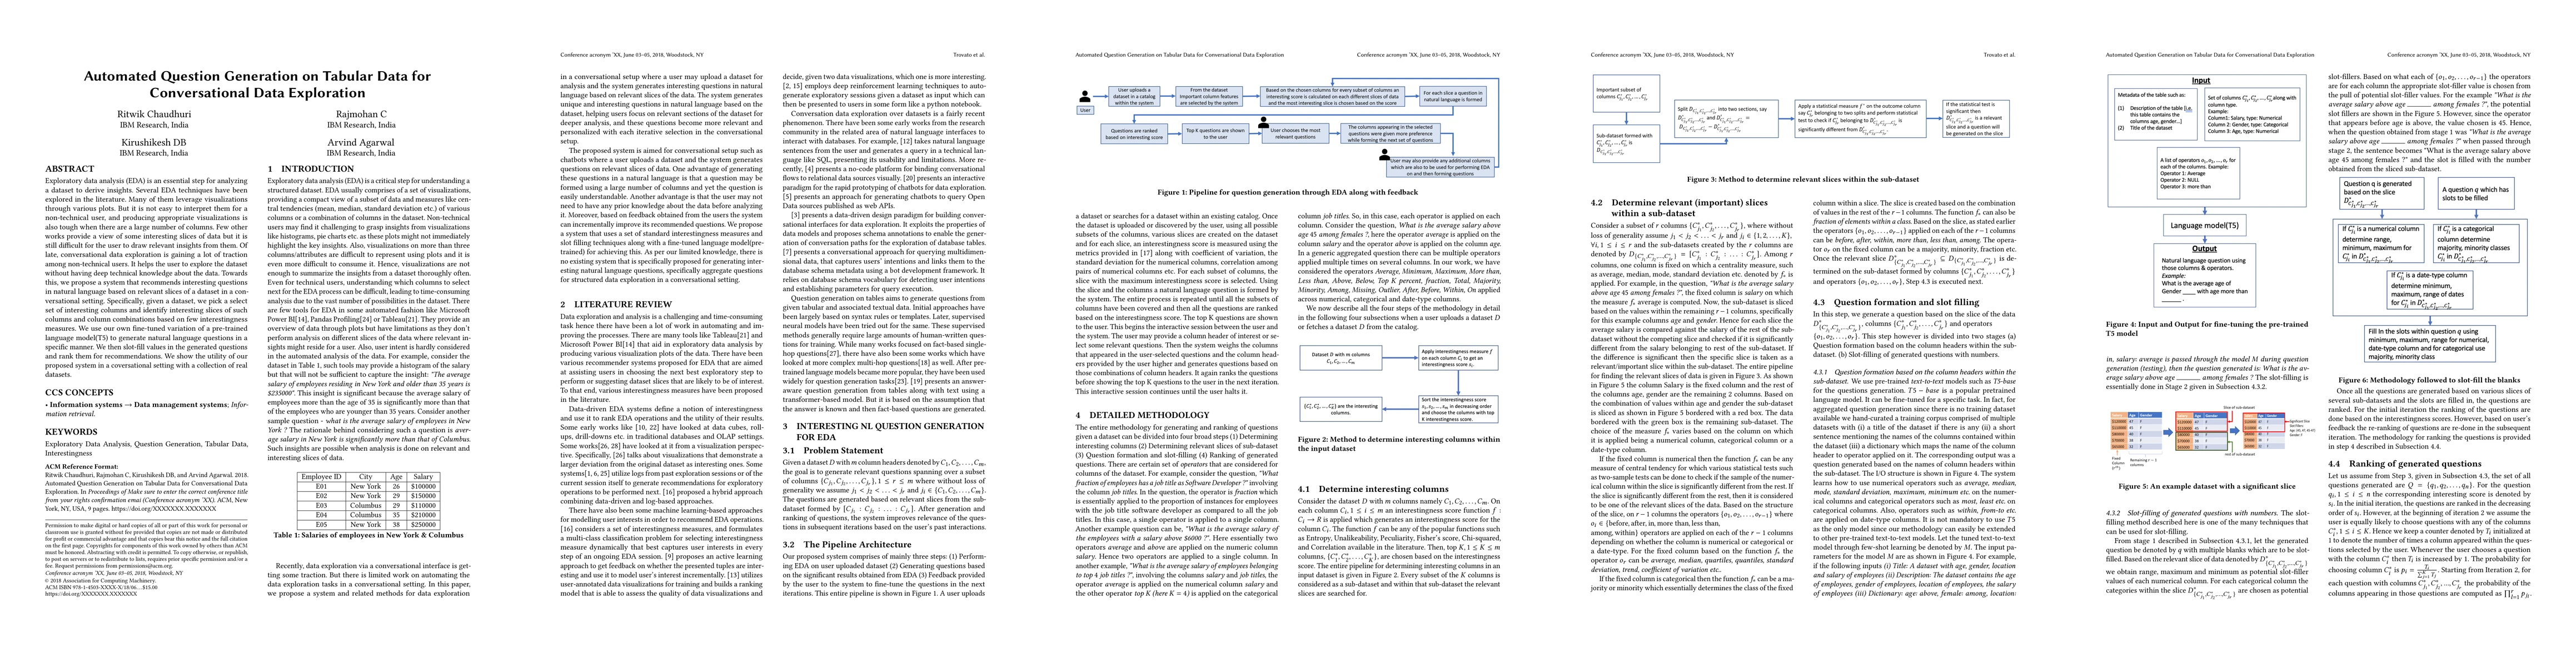
Exploratory data analysis (EDA) is an essential step for analyzing a dataset to derive insights. Several EDA techniques have been explored in the literature. Many of them leverage visualizations through various plots. But it is not easy to interpret them for a non-technical user, and producing appropriate visualizations is also tough when there are a large number of columns. Few other works provide a view of some interesting slices of data but it is still difficult for the user to draw relevant insights from them. Of late, conversational data exploration is gaining a lot of traction among non-technical users. It helps the user to explore the dataset without having deep technical knowledge about the data. Towards this, we propose a system that recommends interesting questions in natural language based on relevant slices of a dataset in a conversational setting. Specifically, given a dataset, we pick a select set of interesting columns and identify interesting slices of such columns and column combinations based on few interestingness measures. We use our own fine-tuned variation of a pre-trained language model(T5) to generate natural language questions in a specific manner. We then slot-fill values in the generated questions and rank them for recommendations. We show the utility of our proposed system in a coversational setting with a collection of real datasets.
AI Key Findings
Get AI-generated insights about this paper's methodology, results, significance, and more — seven facets brought into focus.
Impact
Authors
PDF Preview
Key Terms
Citation Network
Current paper (gray), citations (green), references (blue)
Display is limited for performance on very large graphs.
Discussion 0