Background PM10 atmosphere: In the seek of a multifractal characterization using complex networks
Publication
Metrics
AI Quick Summary
This study employs complex networks to analyze PM10 fluctuations in the Caribbean, focusing on African dust seasonality. The research finds that the Upside-Down Visibility Graph (UDVG) is more effective than the Visibility Graph (VG) in identifying PM10 background atmosphere, especially during high dust seasons.
Paper Preview
Abstract
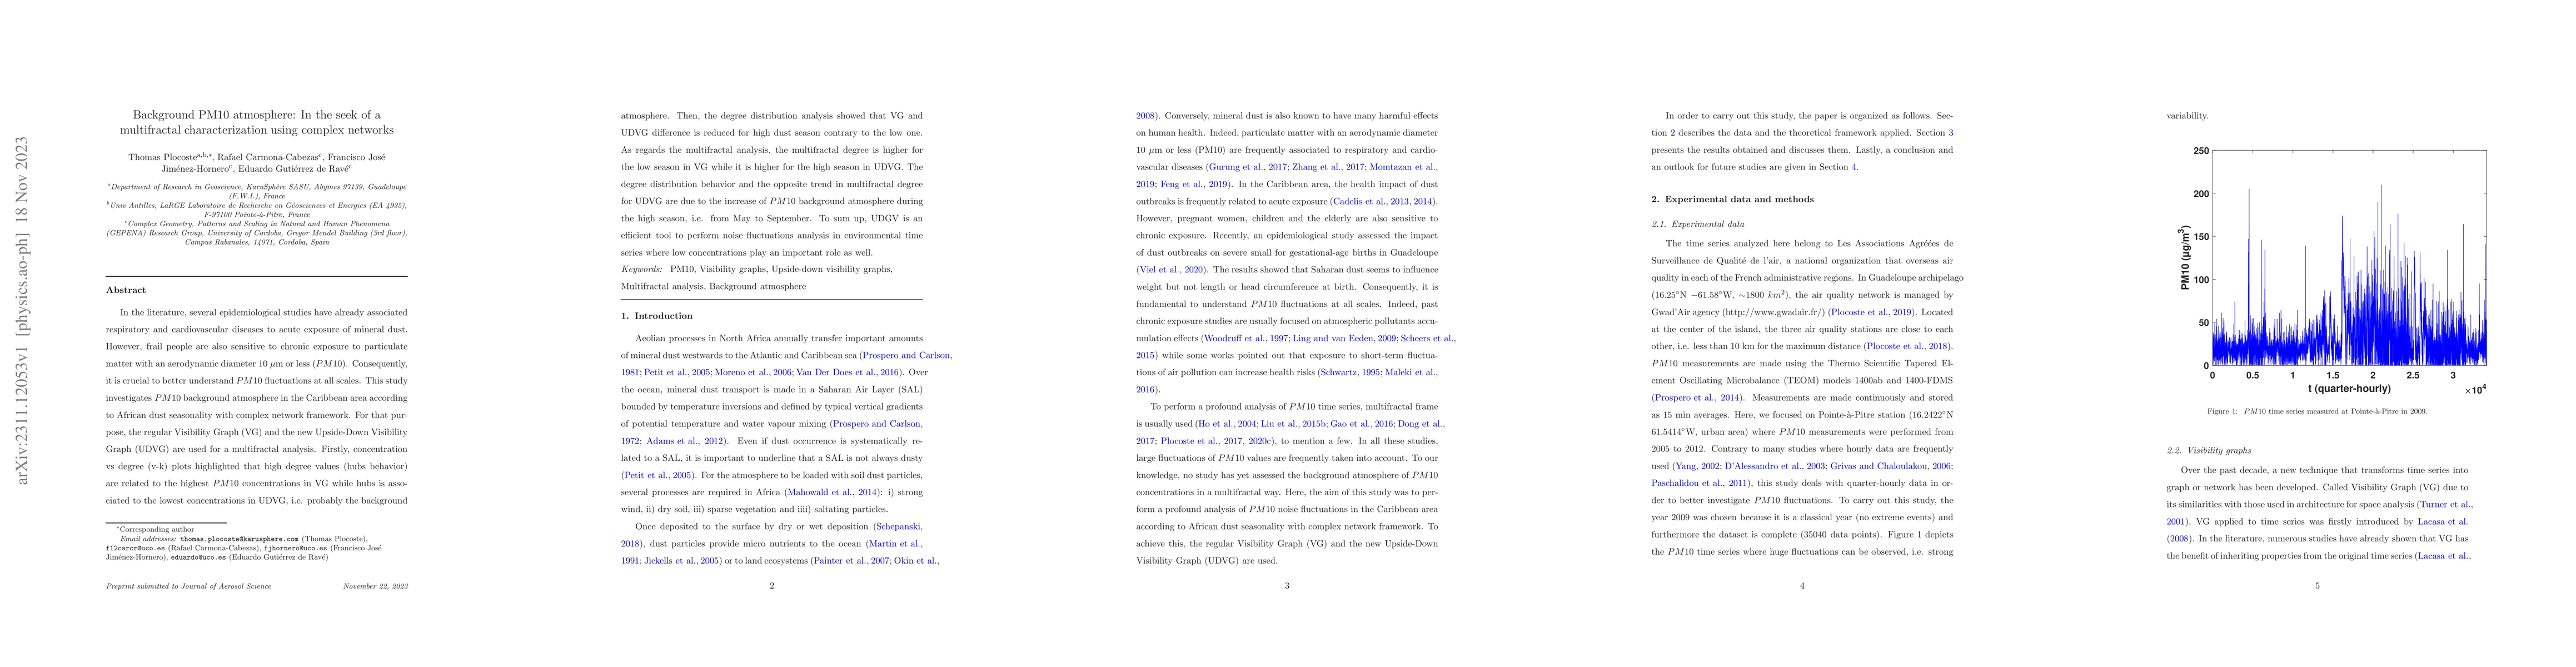
In the literature, several epidemiological studies have already associated respiratory and cardiovascular diseases to acute exposure of mineral dust. However, frail people are also sensitive to chronic exposure to particulate matter with an aerodynamic diameter 10{\mu}m or less (PM10). Consequently, it is crucial to better understand PM10 fluctuations at all scales. This study investigates PM10 background atmosphere in the Caribbean area according to African dust seasonality with complex network framework. For that purpose, the regular Visibility Graph (VG) and the new Upside-Down Visibility Graph (UDVG) are used for a multifractal analysis. Firstly, concentration vs degree (v-k) plots highlighted that high degree values (hubs behavior) are related to the highest PM10 concentrations in VG while hubs is associated to the lowest concentrations in UDVG, i.e. probably the background atmosphere. Then, the degree distribution analysis showed that VG and UDVG difference is reduced for high dust season contrary to the low one. As regards the multifractal analysis, the multifractal degree is higher for the low season in VG while it is higher for the high season in UDVG. The degree distribution behavior and the opposite trend in multifractal degree for UDVG are due to the increase of PM10 background atmosphere during the high season, i.e. from May to September. To sum up, UDGV is an efficient tool to perform noise fluctuations analysis in environmental time series where low concentrations play an important role as well.
AI Key Findings
Get AI-generated insights about this paper's methodology, results, significance, and more — seven facets brought into focus.
Impact
Paper Details
Authors
PDF Preview
Key Terms
Citation Network
Current paper (gray), citations (green), references (blue)
Display is limited for performance on very large graphs.
Discussion 0