Publication
Metrics
AI Quick Summary
A study of 192 galaxy clusters found that X-ray temperatures inferred from broad-band spectra are often cooler than those from hard-band spectra, suggesting the presence of cool gas. The diagnostic tool has been shown to be sensitive to secondary cooling components in merging systems.
Paper Preview
Abstract
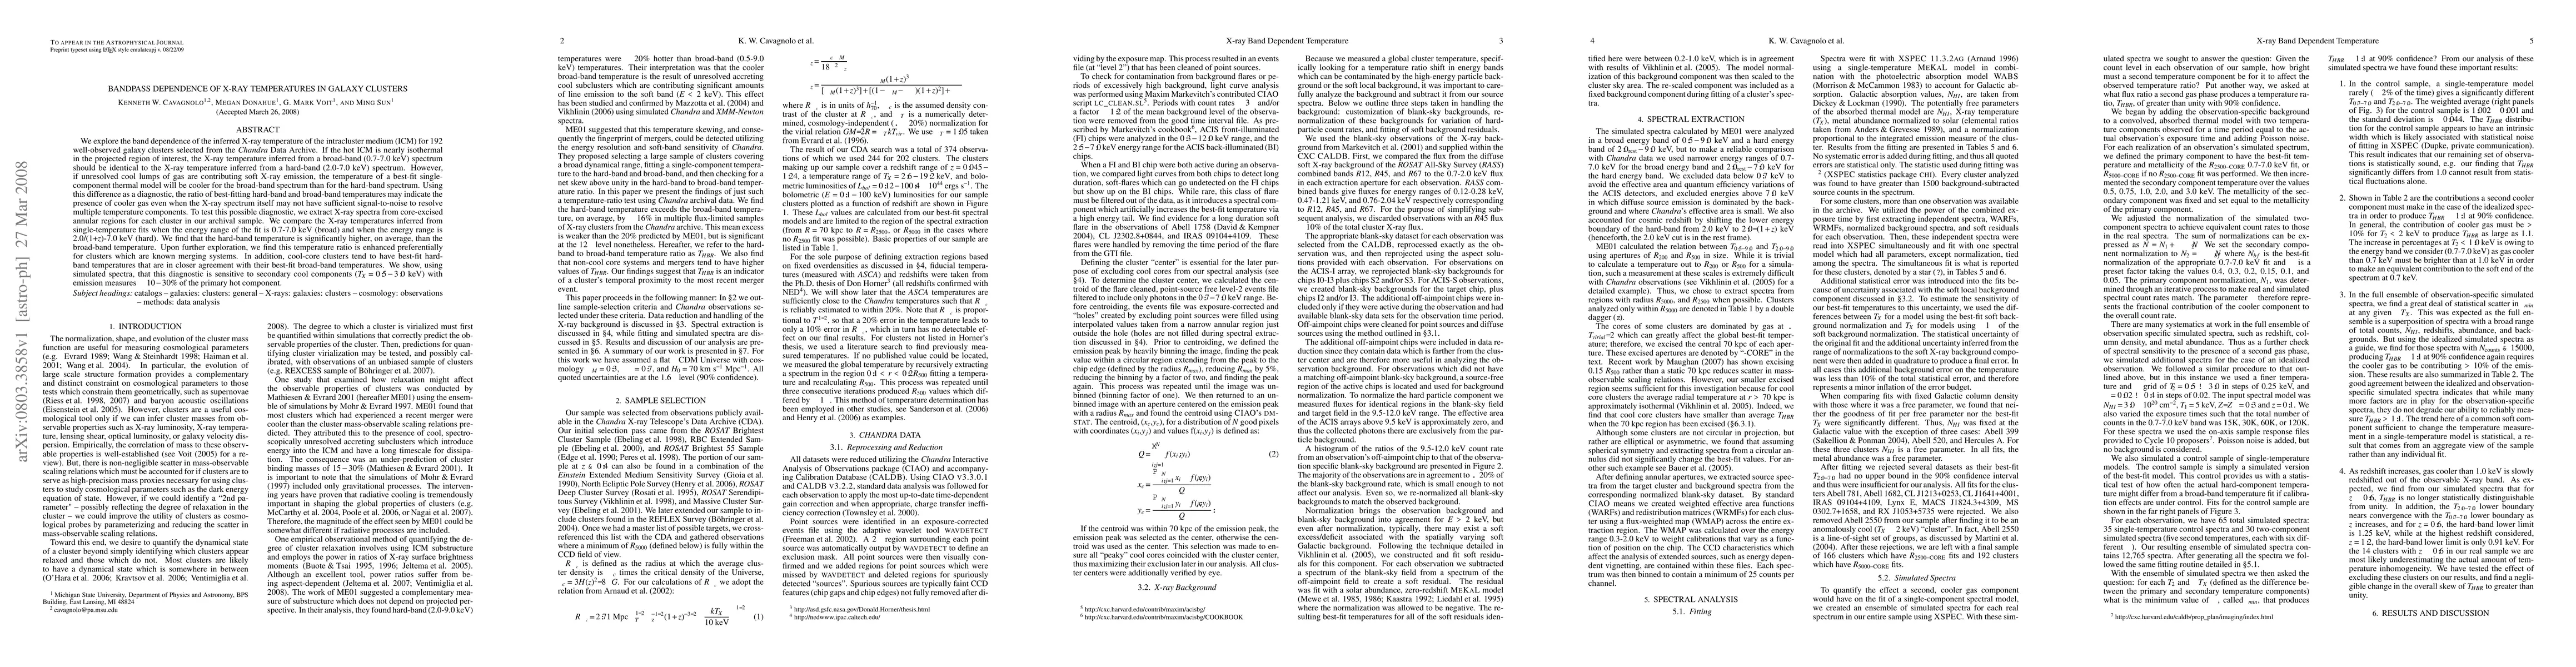
We explore the band dependence of the inferred X-ray temperature of the intracluster medium (ICM) for 192 well-observed galaxy clusters selected from the Chandra Data Archive. If the hot ICM is nearly isothermal in the projected region of interest, the X-ray temperature inferred from a broad-band (0.7-7.0 keV) spectrum should be identical to the X-ray temperature inferred from a hard-band (2.0-7.0 keV) spectrum. However, if unresolved cool lumps of gas are contributing soft X-ray emission, the temperature of a best-fit single-component thermal model will be cooler for the broad-band spectrum than for the hard-band spectrum. Using this difference as a diagnostic, the ratio of best-fitting hard-band and broad-band temperatures may indicate the presence of cooler gas even when the X-ray spectrum itself may not have sufficient signal-to-noise to resolve multiple temperature components. To test this possible diagnostic, we extract X-ray spectra from core-excised annular regions for each cluster in our archival sample. We compare the X-ray temperatures inferred from single-temperature fits when the energy range of the fit is 0.7-7.0 keV (broad) and when the energy range is 2.0/(1+z)-7.0 keV (hard). We find that the hard-band temperature is significantly higher, on average, than the broad-band temperature. Upon further exploration, we find this temperature ratio is enhanced preferentially for clusters which are known merging systems. In addition, cool-core clusters tend to have best-fit hard-band temperatures that are in closer agreement with their best-fit broad-band temperatures. We show, using simulated spectra, that this diagnostic is sensitive to secondary cool components (TX = 0.5-3.0 keV) with emission measures >10-30% of the primary hot component.
AI Key Findings
Get AI-generated insights about this paper's methodology, results, significance, and more — seven facets brought into focus.
Impact
Paper Details
PDF Preview
Key Terms
Citation Network
Current paper (gray), citations (green), references (blue)
Display is limited for performance on very large graphs.
Discussion 0