This paper explores how Bayesian inference can enhance belief updating from visualized data, demonstrating that Bayesian-assisted techniques improve people's updating accuracy, especially for small data samples. For larger samples, the effectiveness hinges on individuals' trust in data sources, highlighting the importance of understanding subjective uncertainty in visualization interpretation.
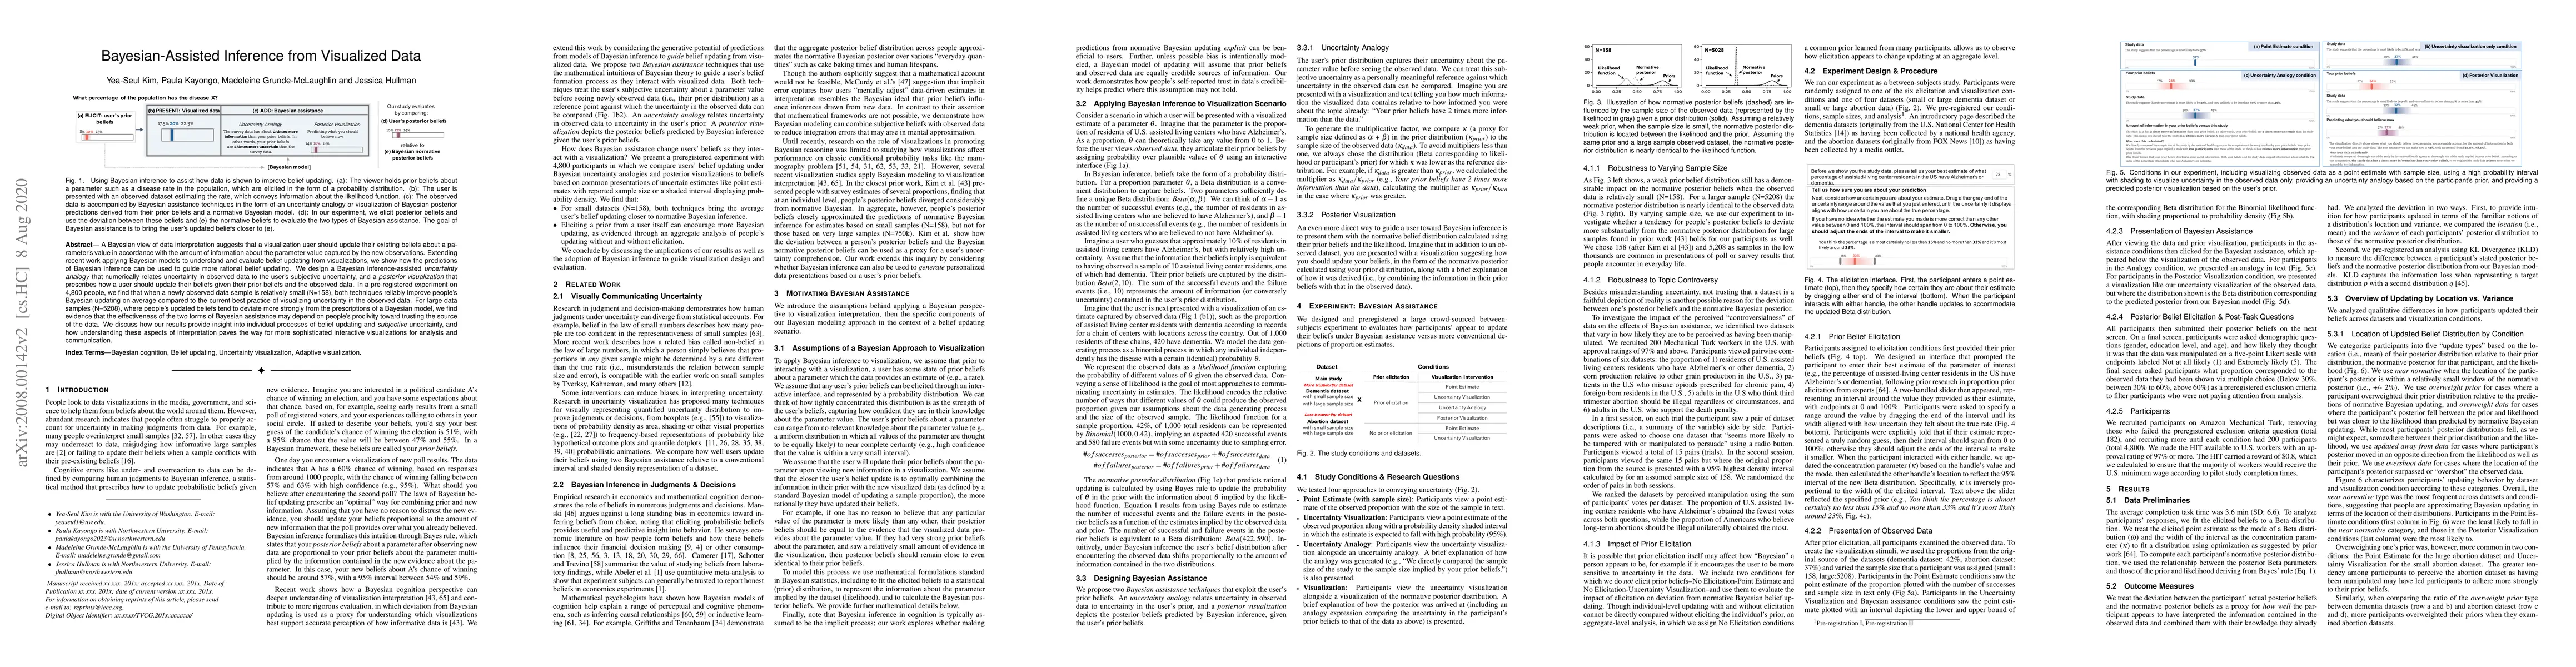
A Bayesian view of data interpretation suggests that a visualization user should update their existing beliefs about a parameter's value in accordance with the amount of information about the parameter value captured by the new observations. Extending recent work applying Bayesian models to understand and evaluate belief updating from visualizations, we show how the predictions of Bayesian inference can be used to guide more rational belief updating. We design a Bayesian inference-assisted uncertainty analogy that numerically relates uncertainty in observed data to the user's subjective uncertainty, and a posterior visualization that prescribes how a user should update their beliefs given their prior beliefs and the observed data. In a pre-registered experiment on 4,800 people, we find that when a newly observed data sample is relatively small (N=158), both techniques reliably improve people's Bayesian updating on average compared to the current best practice of visualizing uncertainty in the observed data. For large data samples (N=5208), where people's updated beliefs tend to deviate more strongly from the prescriptions of a Bayesian model, we find evidence that the effectiveness of the two forms of Bayesian assistance may depend on people's proclivity toward trusting the source of the data. We discuss how our results provide insight into individual processes of belief updating and subjective uncertainty, and how understanding these aspects of interpretation paves the way for more sophisticated interactive visualizations for analysis and communication.
Get AI-generated insights about this paper's methodology, results, and significance.
Current paper (gray), citations (green), references (blue)
Antti Honkela, Ossi Räisä, Joonas Jälkö
Nianqiao Ju, Ruobin Gong, Jordan A. Awan et al.
Title | Authors | Year | Actions |
---|---|---|---|
Do You"Trust"This Visualization? An Inventory to Measure Trust in Visualizations
|
Huichen Will Wang, Kylie Lin, Andrew Cohen, Ryan Kennedy, Zach Zwald, Carolina Nobre, Cindy Xiong Bearfield
|
2025
|
View Paper |
Unveiling High-dimensional Backstage: A Survey for Reliable Visual Analytics with Dimensionality Reduction
|
Hyeon Jeon, Hyunwoo Lee, Yun-Hsin Kuo, Taehyun Yang, Daniel Archambault, Sungahn Ko, Takanori Fujiwara, Kwan-Liu Ma, Jinwook Seo
|
2025
|
View Paper |
Designing and Evaluating Sampling Strategies for Multiple-Forecast Visualization (MFV)
|
Ruishi Zou, Siyi Wu, Bingsheng Yao, Dakuo Wang, Lace M. Padilla
|
2024
|
View Paper |
Entanglements for Visualization: Changing Research Outcomes through Feminist Theory
|
Derya Akbaba, Lauren Klein, Miriah Meyer
|
2024
|
View Paper |
Beyond Correlation: Incorporating Counterfactual Guidance to Better Support Exploratory Visual Analysis
|
Arran Zeyu Wang, D. Borland, David Gotz
|
2024
|
View Paper |
Causal Priors and Their Influence on Judgements of Causality in Visualized Data
|
Arran Zeyu Wang, D. Borland, Tabitha C. Peck, Wenyuan Wang, David Gotz
|
2024
|
View Paper |
Enhancing User Perception of Reliability in Computer Vision: Uncertainty Visualization for Probability Distributions
|
Xinyue Wang, Ruoyu Hu, Chengqi Xue
|
2024
|
View Paper |
Trust Your Gut: Comparing Human and Machine Inference from Noisy Visualizations
|
Ratanond Koonchanok, M. Papka, K. Reda
|
2024
|
View Paper |
From Delays to Densities: Exploring Data Uncertainty through Speech, Text, and Visualization
|
Chase Stokes, Chelsea Sanker, Bridget Cogley, V. Setlur
|
2024
|
View Paper |
NOVA: A visual interface for assessing polarizing media coverage
|
Keshav Dasu, Sam Yu-Te Lee, Ying-Cheng Chen, Kwan-Liu Ma
|
2024
|
View Paper |
Decision Theoretic Foundations for Experiments Evaluating Human Decisions
|
J. Hullman, Alex Kale, Jason D. Hartline
|
2024
|
View Paper |
Eliciting Model Steering Interactions From Users via Data and Visual Design Probes
|
Anamaria Crisan, Maddie Shang, Eric Brochu
|
2023
|
View Paper |
Vistrust: a Multidimensional Framework and Empirical Study of Trust in Data Visualizations
|
Hamza Elhamdadi, Ádám Stefkovics, Johanna Beyer, Eric Mörth, Hanspeter Pfister, Cindy Xiong Bearfield, Carolina Nobre
|
2023
|
View Paper |
EVM: Incorporating Model Checking into Exploratory Visual Analysis
|
Alex Kale, Ziyang Guo, X. Qiao, Jeffrey Heer, J. Hullman
|
2023
|
View Paper |
Taken By Surprise? Evaluating how Bayesian Surprise & Suppression Influences Peoples’ Takeaways in Map Visualizations
|
Akim Ndlovu, Hilson Shrestha, Lane Harrison
|
2023
|
View Paper |
Belief Decay or Persistence? A Mixed‐method Study on Belief Movement Over Time
|
Shrey Gupta, Alireza Karduni, Emily Wall
|
2023
|
View Paper |
Human–Computer Collaboration for Visual Analytics: an Agent‐based Framework
|
S. Monadjemi, Mengtian Guo, D. Gotz, R. Garnett, Alvitta Ottley
|
2023
|
View Paper |
The Rational Agent Benchmark for Data Visualization
|
Yifan Wu, Ziyang Guo, Michail Mamakos, Jason D. Hartline, J. Hullman
|
2023
|
View Paper |
Attitudinal Effects of Data Visualizations and Illustrations in Data Stories
|
M. Garretón, F. Morini, Pablo Celhay, Marian Dörk, Denis Parra
|
2023
|
View Paper |
Visual Belief Elicitation Reduces the Incidence of False Discovery
|
Ratanond Koonchanok, Gauri Yatindra Tawde, Gokul Ragunandhan Narayanasamy, Shalmali Walimbe, K. Reda
|
2023
|
View Paper |
A Design Space for Surfacing Content Recommendations in Visual Analytic Platforms
|
Zhilan Zhou, Wenyuan Wang, Mengtian Guo, Yue Wang, D. Gotz
|
2022
|
View Paper |
Seeing What You Believe or Believing What You See? Belief Biases Correlation Estimation
|
Cindy Xiong, Chase Stokes, Yea-Seul Kim, S. Franconeri
|
2022
|
View Paper |
VIBE: A Design Space for VIsual Belief Elicitation in Data Journalism
|
Shambhavi Mahajan, Bonnie Chen, Alireza Karduni, Yea-Seul Kim, Emily Wall
|
2022
|
View Paper |
Seeking Patterns of Visual Pattern Discovery for Knowledge Building
|
N. Andrienko, G. Andrienko, Siming Chen, Brian D. Fisher
|
2022
|
View Paper |
Round Numbers Can Sharpen Cognition
|
H. A. Nguyen, Jake M. Hofman, D. Goldstein
|
2022
|
View Paper |
Do You See What You Mean? Using Predictive Visualizations to Reduce Optimism in Duration Estimates
|
Morgane Koval, Yvonne Jansen
|
2022
|
View Paper |
Publishing Visualization Studies as Registered Reports: Expected Benefits and Researchers’ Attitudes
|
Lonni Besançon, A. Bezerianos, Pierre Dragicevic, Petra Isenberg, Yvonne Jansen
|
2021
|
View Paper |
Human Reliance on Machine Learning Models When Performance Feedback is Limited: Heuristics and Risks
|
Zhuoran Lu, Ming Yin
|
2021
|
View Paper |
Designing for Interactive Exploratory Data Analysis Requires Theories of Graphical Inference
|
J. Hullman, A. Gelman
|
2021
|
View Paper |
To design interfaces for exploratory data analysis, we need theories of graphical inference
|
J. Hullman, Andrew Gelman
|
2021
|
View Paper |
Comments (0)