Bayesian De-quantization and Data Compression for Low-Energy Physiological Signal Telemonitoring
Publication
Metrics
AI Quick Summary
This paper proposes a two-stage data compressor for low-energy physiological signal telemonitoring using quantized compressed sensing and a Bayesian De-quantization algorithm to recover signals, achieving an average 2.596 BPM estimation error with 50% compression ratio and 2-bit quantization, significantly reducing transmission bit-budget.
Paper Preview
Abstract
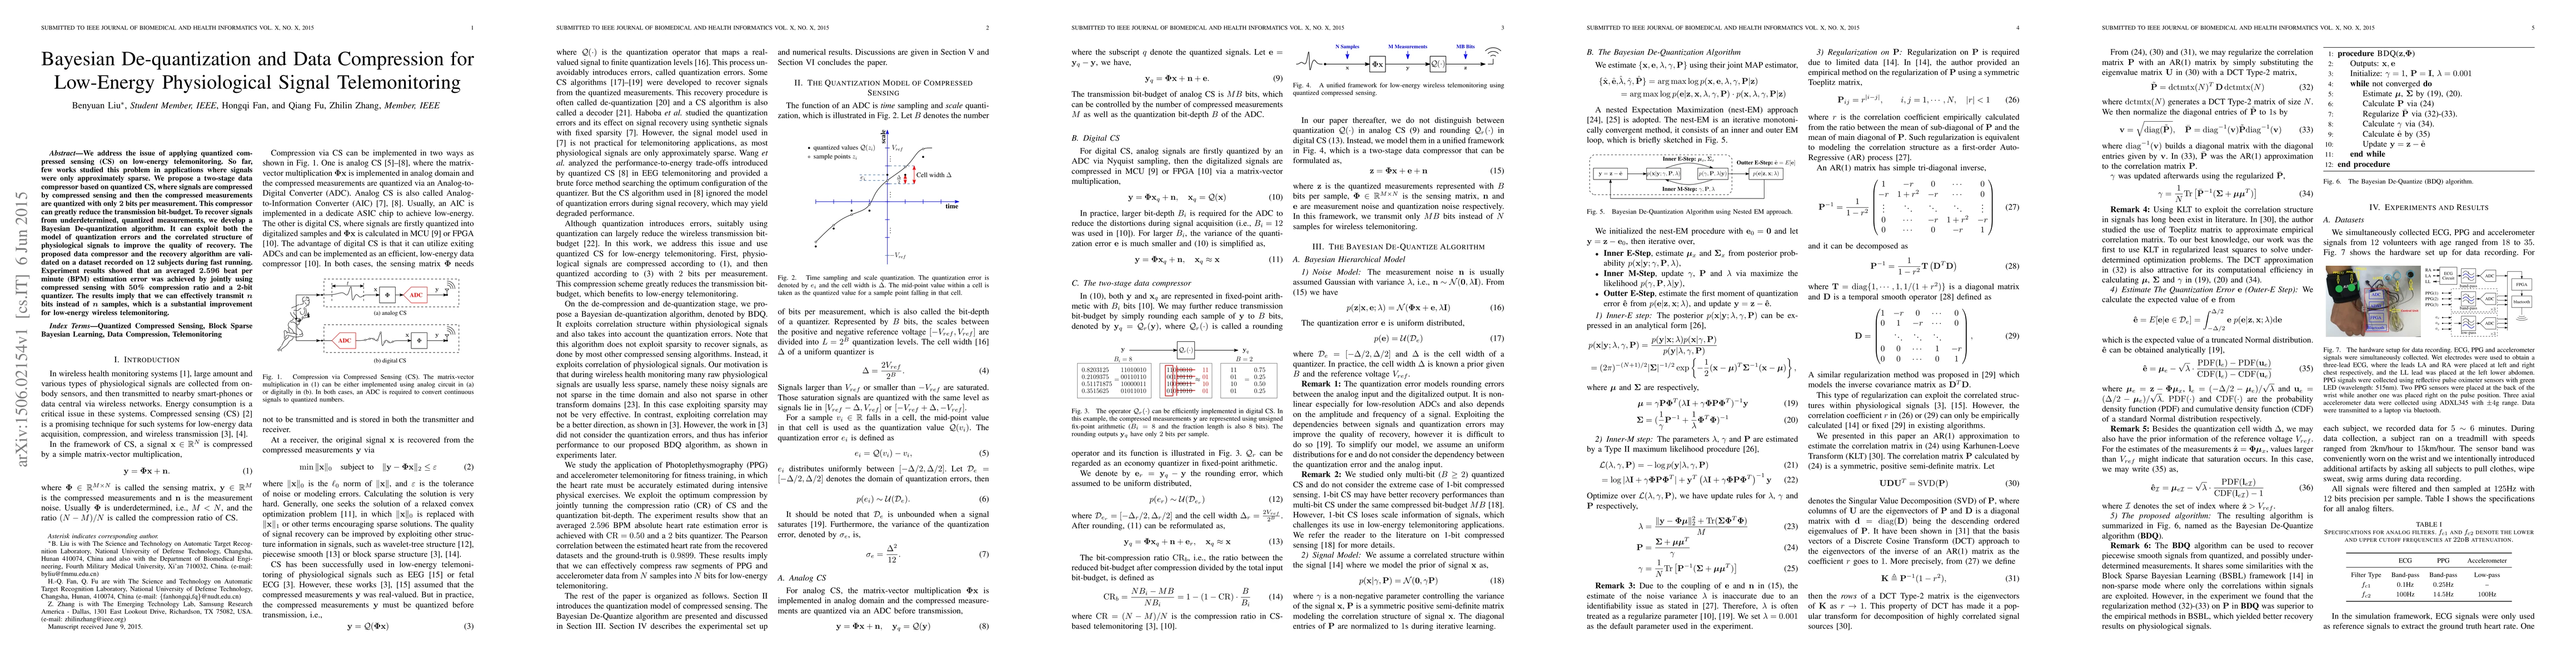
We address the issue of applying quantized compressed sensing (CS) on low-energy telemonitoring. So far, few works studied this problem in applications where signals were only approximately sparse. We propose a two-stage data compressor based on quantized CS, where signals are compressed by compressed sensing and then the compressed measurements are quantized with only 2 bits per measurement. This compressor can greatly reduce the transmission bit-budget. To recover signals from underdetermined, quantized measurements, we develop a Bayesian De-quantization algorithm. It can exploit both the model of quantization errors and the correlated structure of physiological signals to improve the quality of recovery. The proposed data compressor and the recovery algorithm are validated on a dataset recorded on 12 subjects during fast running. Experiment results showed that an averaged 2.596 beat per minute (BPM) estimation error was achieved by jointly using compressed sensing with 50% compression ratio and a 2-bit quantizer. The results imply that we can effectively transmit n bits instead of n samples, which is a substantial improvement for low-energy wireless telemonitoring.
AI Key Findings
Get AI-generated insights about this paper's methodology, results, significance, and more — seven facets brought into focus.
Impact
Paper Details
PDF Preview
Key Terms
Citation Network
Current paper (gray), citations (green), references (blue)
Display is limited for performance on very large graphs.
Discussion 0