Bayesian EWMA and CUSUM Control Charts Under Different Loss Functions
Publication
Metrics
AI Quick Summary
This paper constructs Bayesian EWMA and CUSUM control charts for profile monitoring, evaluating their performance under various loss functions and prior distributions through simulation studies. The results guide the selection of optimal parameters based on metrics like average run length and sensitivity analysis.
Paper Preview
Abstract
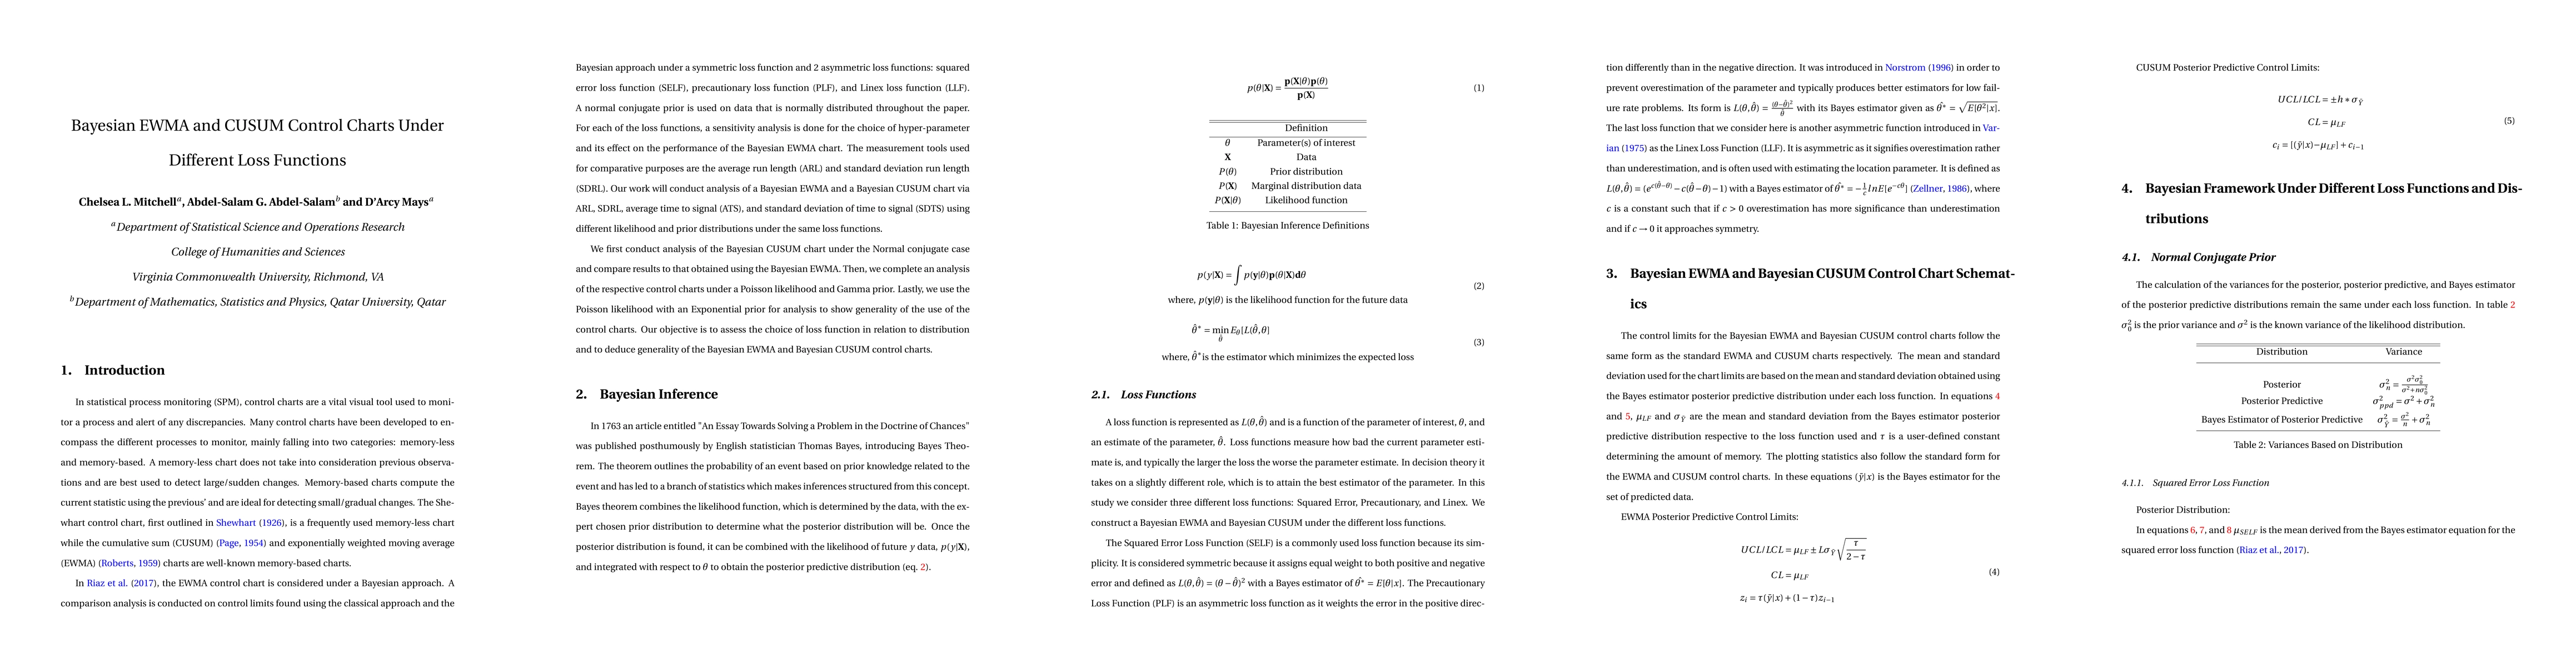
The Exponentially Weighted Moving Average (EWMA) and Cumulative Sum (CUSUM) control charts have been used in profile monitoring to track drift shifts that occur in a monitored process. We construct Bayesian EWMA and Bayesian CUSUM charts informed by posterior and posterior predictive distributions using different loss functions, prior distributions, and likelihood distributions. A simulation study is performed, and the performance of the charts are evaluated via average run length (ARL), standard deviation of the run length (SDRL), average time to signal (ATS), and standard deviation of time to signal (SDTS). A sensitivity analysis is conducted using choices for the smoothing parameter, out-of-control shift size, and hyper-parameters of the distribution. Based on obtained results, we provide recommendations for use of the Bayesian EWMA and Bayesian CUSUM control charts.
AI Key Findings
Get AI-generated insights about this paper's methodology, results, significance, and more — seven facets brought into focus.
Impact
Paper Details
Authors
PDF Preview
Key Terms
Citation Network
Current paper (gray), citations (green), references (blue)
Display is limited for performance on very large graphs.
Discussion 0