Bayesian Functional Graphical Models with Change-Point Detection
Publication
Metrics
AI Quick Summary
This paper proposes a Bayesian functional graphical model for time series data to infer dynamic connections among multiple functions. The model uses a block-structured sparsity prior and Gibbs sampling for efficient computation and includes change-point detection to identify time-varying connectivity patterns. Simulation studies show superior graph selection performance compared to existing methods.
Paper Preview
Abstract
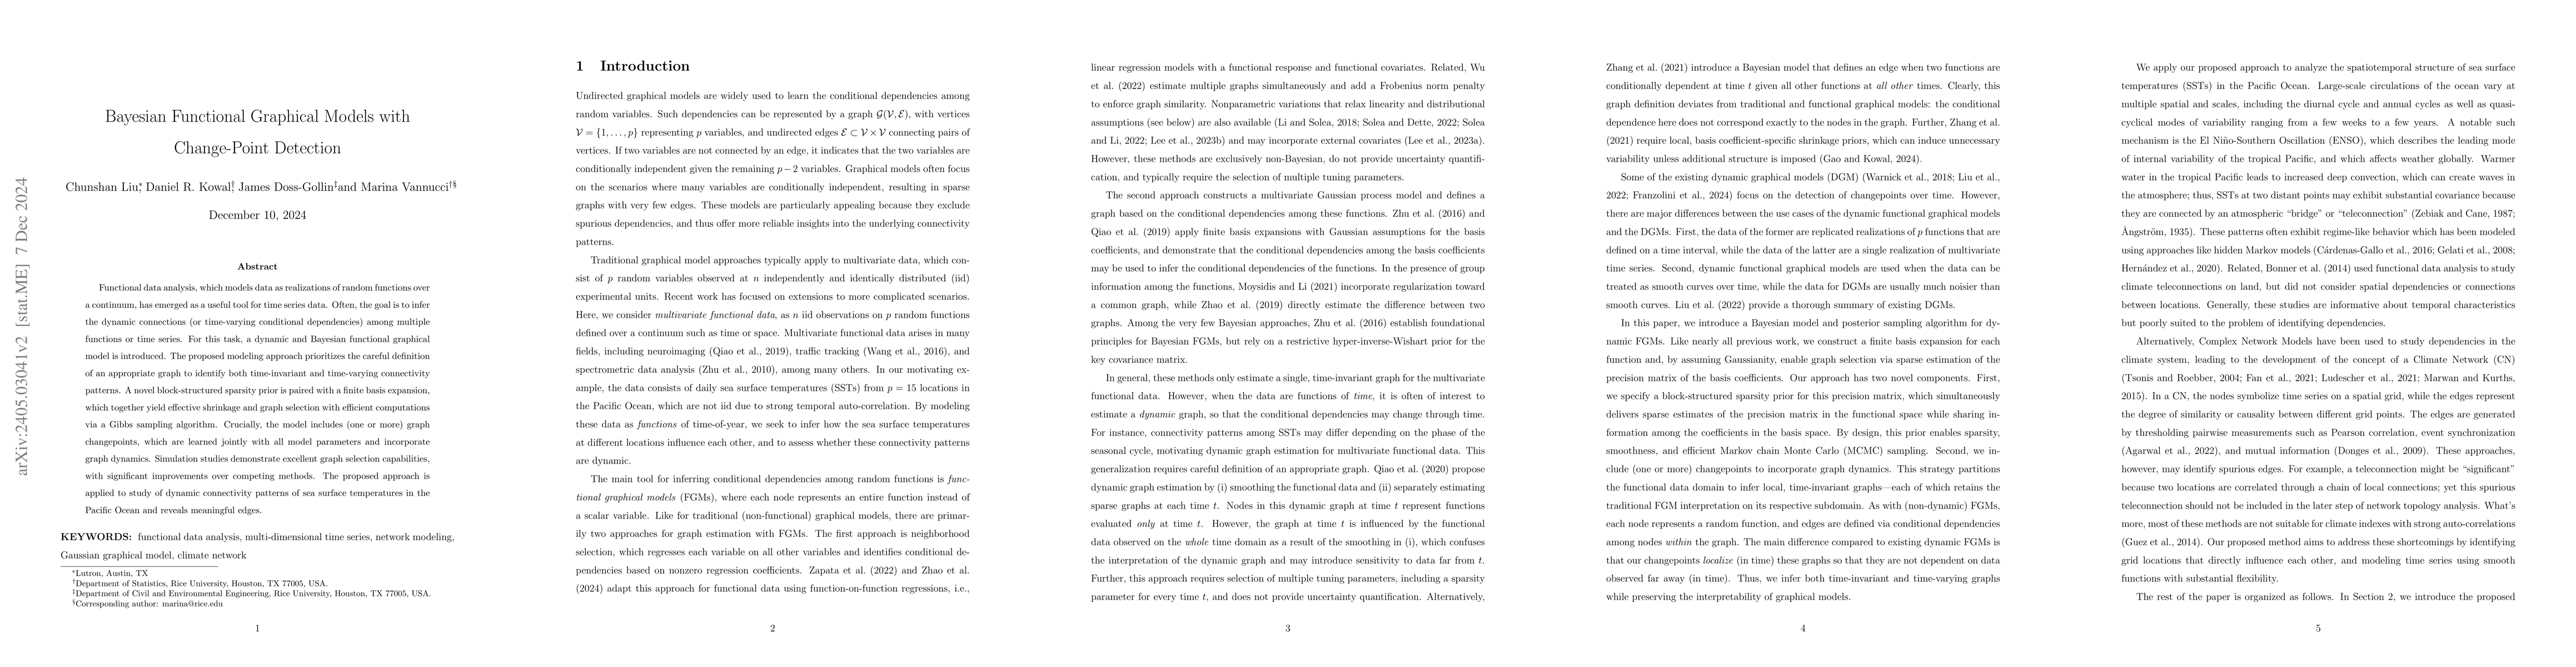
Functional data analysis, which models data as realizations of random functions over a continuum, has emerged as a useful tool for time series data. Often, the goal is to infer the dynamic connections (or time-varying conditional dependencies) among multiple functions or time series. For this task, we propose a dynamic and Bayesian functional graphical model. Our modeling approach prioritizes the careful definition of an appropriate graph to identify both time-invariant and time-varying connectivity patterns. We introduce a novel block-structured sparsity prior paired with a finite basis expansion, which together yield effective shrinkage and graph selection with efficient computations via a Gibbs sampling algorithm. Crucially, the model includes (one or more) graph changepoints, which are learned jointly with all model parameters and incorporate graph dynamics. Simulation studies demonstrate excellent graph selection capabilities, with significant improvements over competing methods. We apply the proposed approach to study of dynamic connectivity patterns of sea surface temperatures in the Pacific Ocean and discovers meaningful edges.
AI Key Findings
Get AI-generated insights about this paper's methodology, results, significance, and more — seven facets brought into focus.
Impact
Paper Details
Authors
PDF Preview
Key Terms
Citation Network
Current paper (gray), citations (green), references (blue)
Display is limited for performance on very large graphs.
Discussion 0