Bayesian modelling and quantification of Raman spectroscopy
Publication
Metrics
AI Quick Summary
This paper introduces a Bayesian modelling approach using a sequential Monte Carlo (SMC) algorithm to analyze Raman spectroscopy data, addressing the challenge of nonuniform background noise. The method separates spectra into peaks and baselines, enabling accurate quantification of molecular concentrations at low levels, which is crucial for analytical chemistry.
Paper Preview
Abstract
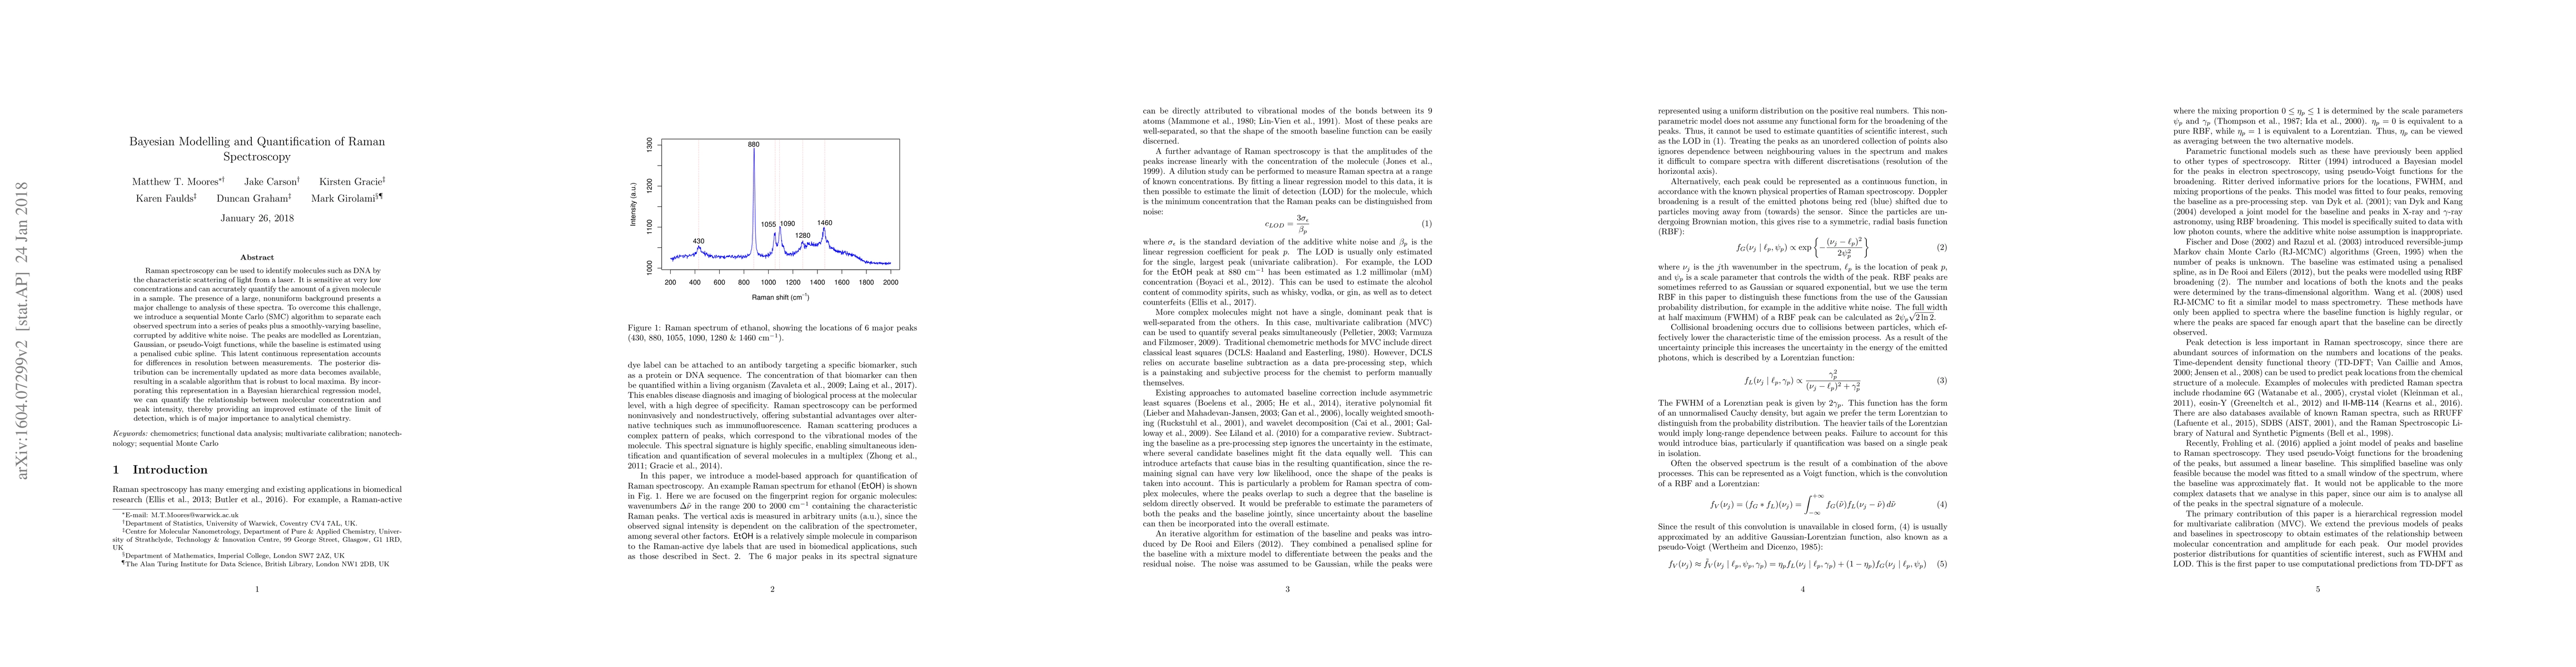
Raman spectroscopy can be used to identify molecules such as DNA by the characteristic scattering of light from a laser. It is sensitive at very low concentrations and can accurately quantify the amount of a given molecule in a sample. The presence of a large, nonuniform background presents a major challenge to analysis of these spectra. To overcome this challenge, we introduce a sequential Monte Carlo (SMC) algorithm to separate each observed spectrum into a series of peaks plus a smoothly-varying baseline, corrupted by additive white noise. The peaks are modelled as Lorentzian, Gaussian, or pseudo-Voigt functions, while the baseline is estimated using a penalised cubic spline. This latent continuous representation accounts for differences in resolution between measurements. The posterior distribution can be incrementally updated as more data becomes available, resulting in a scalable algorithm that is robust to local maxima. By incorporating this representation in a Bayesian hierarchical regression model, we can quantify the relationship between molecular concentration and peak intensity, thereby providing an improved estimate of the limit of detection, which is of major importance to analytical chemistry.
AI Key Findings
Get AI-generated insights about this paper's methodology, results, significance, and more — seven facets brought into focus.
Impact
Paper Details
PDF Preview
Key Terms
Citation Network
Current paper (gray), citations (green), references (blue)
Display is limited for performance on very large graphs.
Discussion 0