Bayesian Modelling of Alluvial Diagram Complexity
Publication
Metrics
AI Quick Summary
This study investigates how visual features of alluvial diagrams impact their interpretation, finding that complexity depends on type (task vs. perceived) and employing Bayesian modelling to predict diagram classification.
Paper Preview
Abstract
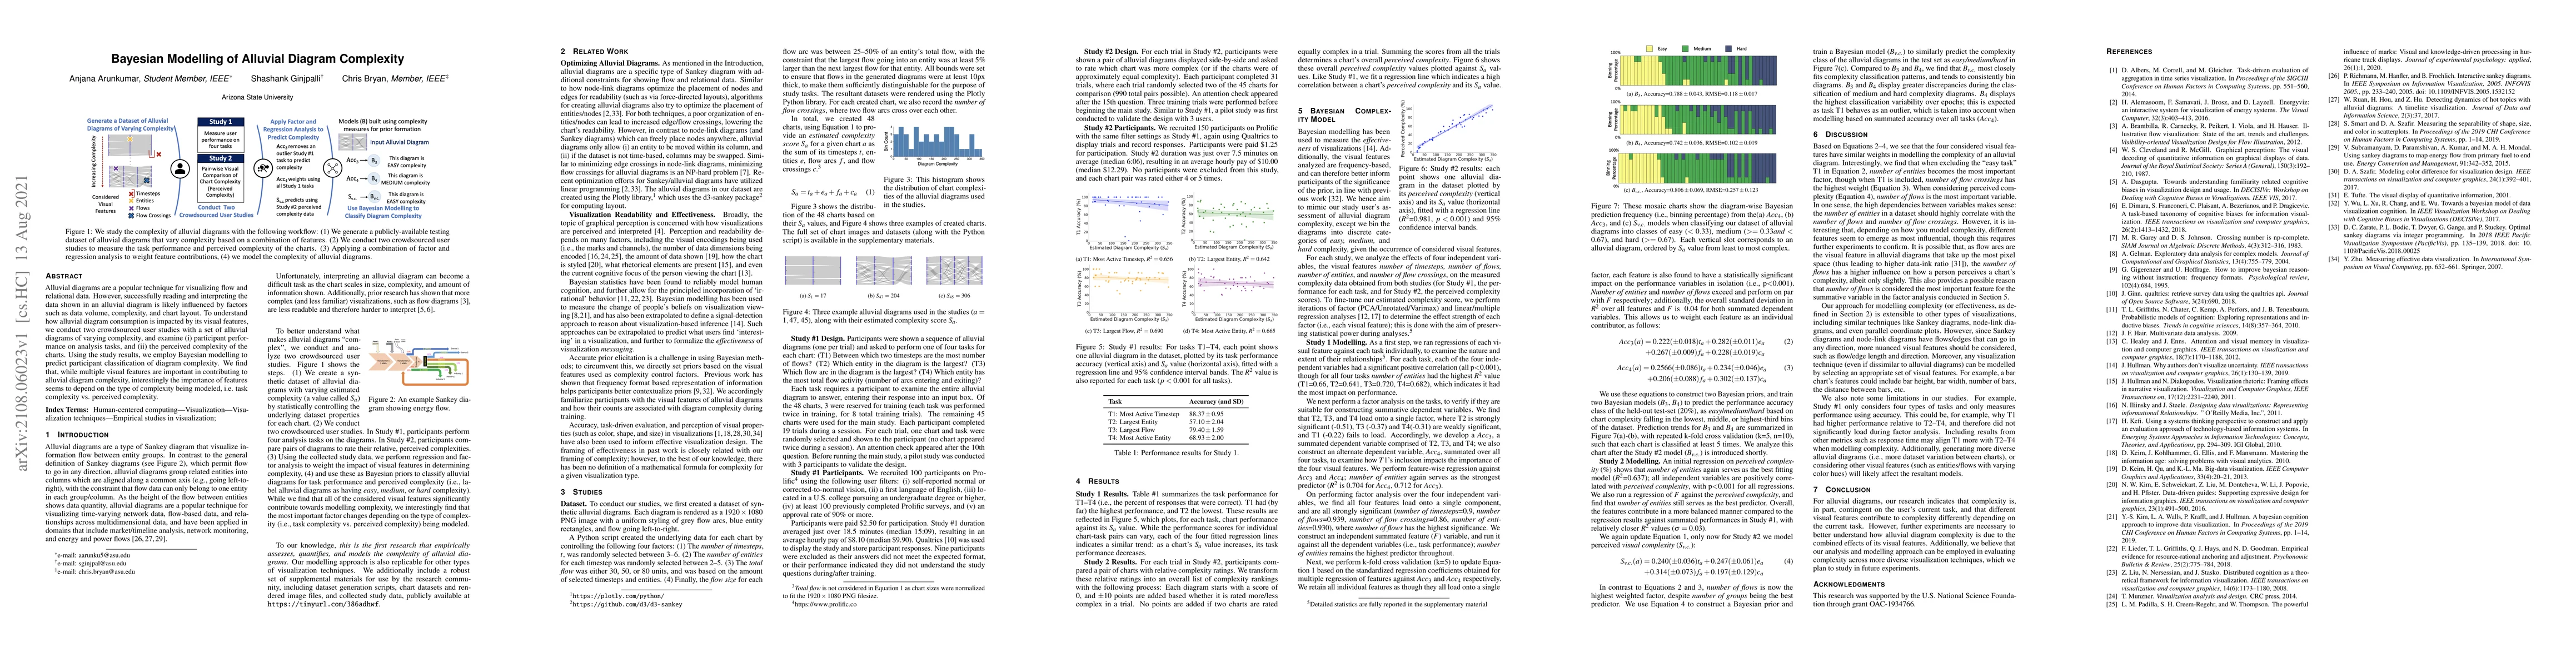
Alluvial diagrams are a popular technique for visualizing flow and relational data. However, successfully reading and interpreting the data shown in an alluvial diagram is likely influenced by factors such as data volume, complexity, and chart layout. To understand how alluvial diagram consumption is impacted by its visual features, we conduct two crowdsourced user studies with a set of alluvial diagrams of varying complexity, and examine (i) participant performance on analysis tasks, and (ii) the perceived complexity of the charts. Using the study results, we employ Bayesian modelling to predict participant classification of diagram complexity. We find that, while multiple visual features are important in contributing to alluvial diagram complexity, interestingly the importance of features seems to depend on the type of complexity being modeled, i.e. task complexity vs. perceived complexity.
AI Key Findings
Get AI-generated insights about this paper's methodology, results, significance, and more — seven facets brought into focus.
Impact
Paper Details
Authors
PDF Preview
Key Terms
Citation Network
Current paper (gray), citations (green), references (blue)
Display is limited for performance on very large graphs.
Discussion 0