Bayesian Poisson Regression and Tensor Train Decomposition Model for Learning Mortality Pattern Changes during COVID-19 Pandemic
Publication
Metrics
AI Quick Summary
This paper combines Bayesian Poisson regression with tensor train decomposition to analyze Italian mortality data from 2015 to 2020, aiming to understand changes in mortality patterns due to the COVID-19 pandemic. The model identifies differential effects of interventions and reveals latent classes underlying demographic and temporal patterns.
Paper Preview
Abstract
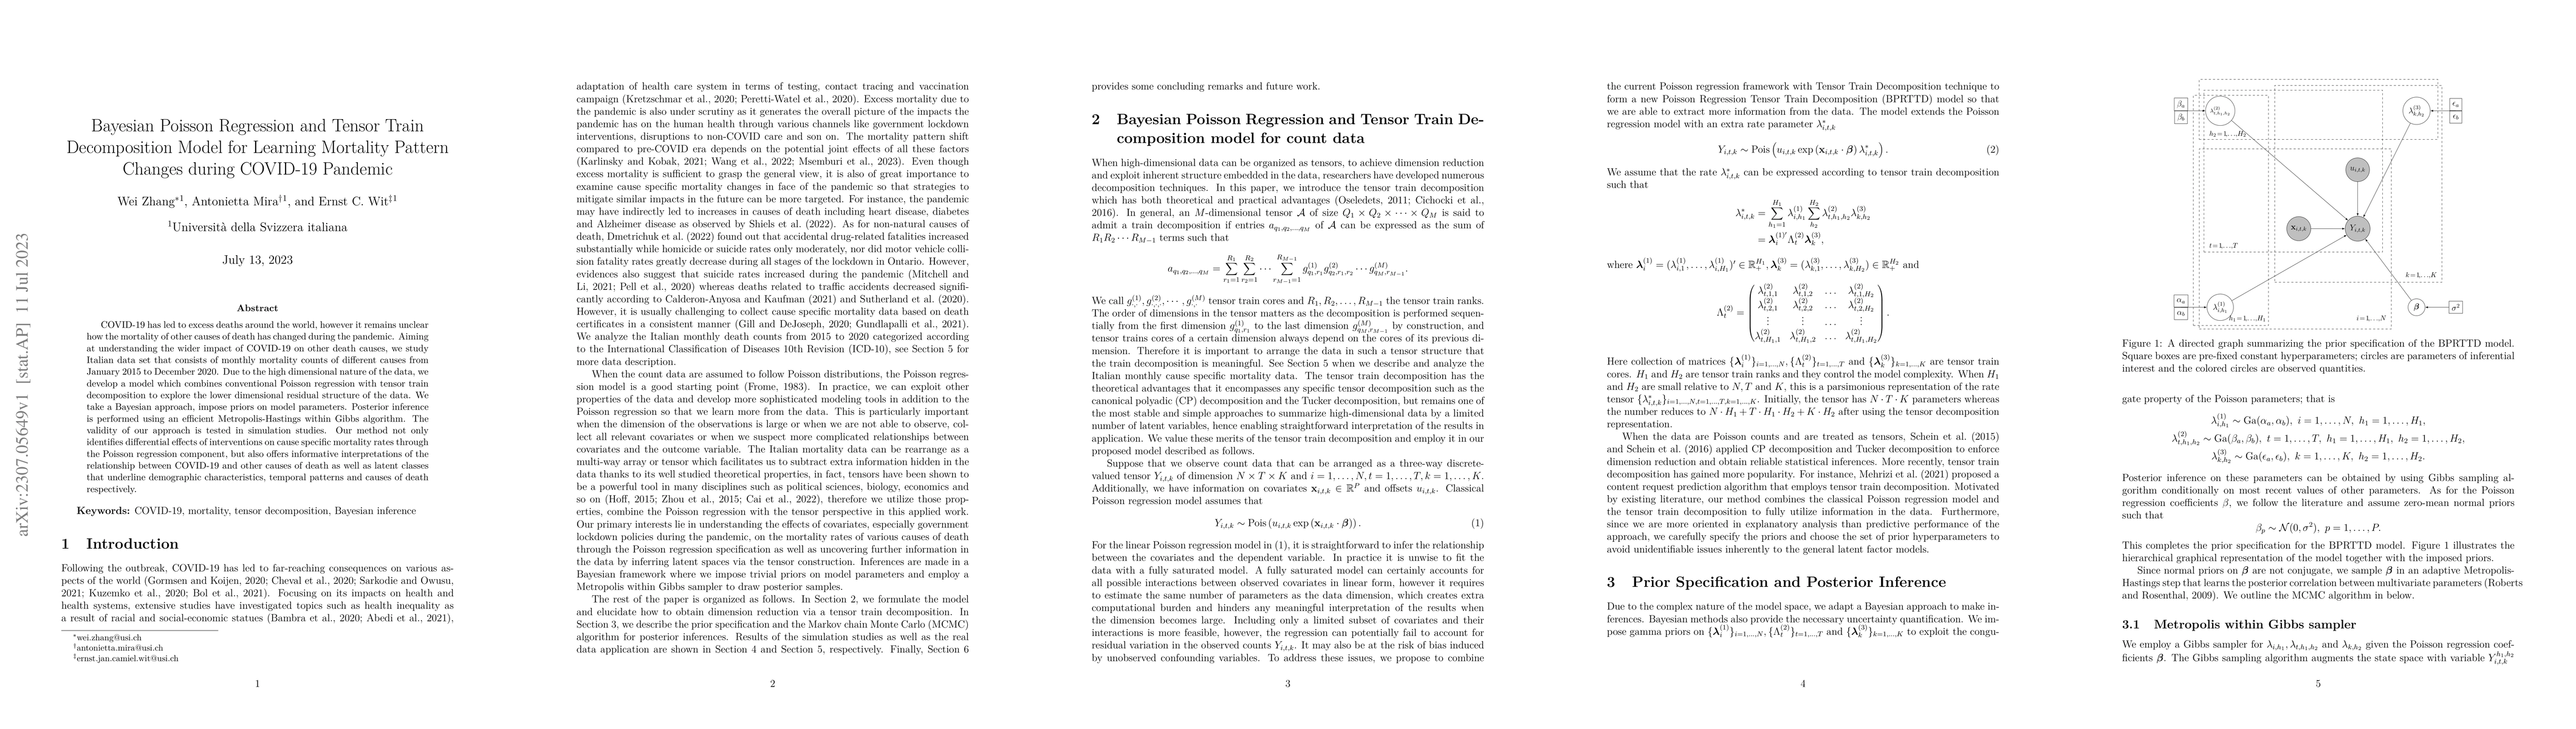
COVID-19 has led to excess deaths around the world, however it remains unclear how the mortality of other causes of death has changed during the pandemic. Aiming at understanding the wider impact of COVID-19 on other death causes, we study Italian data set that consists of monthly mortality counts of different causes from January 2015 to December 2020. Due to the high dimensional nature of the data, we develop a model which combines conventional Poisson regression with tensor train decomposition to explore the lower dimensional residual structure of the data. We take a Bayesian approach, impose priors on model parameters. Posterior inference is performed using an efficient Metropolis-Hastings within Gibbs algorithm. The validity of our approach is tested in simulation studies. Our method not only identifies differential effects of interventions on cause specific mortality rates through the Poisson regression component, but also offers informative interpretations of the relationship between COVID-19 and other causes of death as well as latent classes that underline demographic characteristics, temporal patterns and causes of death respectively.
AI Key Findings
Get AI-generated insights about this paper's methodology, results, significance, and more — seven facets brought into focus.
Impact
Paper Details
Authors
PDF Preview
Key Terms
Citation Network
Current paper (gray), citations (green), references (blue)
Display is limited for performance on very large graphs.
Discussion 0