Bayesian reconstruction of impact parameter distributions from two observables for intermediate energy heavy ion collisions
Publication
Metrics
AI Quick Summary
This paper extends Bayesian methods to reconstruct impact parameter distributions in intermediate energy heavy ion collisions using two observables: charged particle multiplicity and total transverse momentum. It employs the $K$-means clustering method to sort events and discusses the intrinsic fluctuations in the nonequilibrium process, aiming to better understand the fragmentation mechanism.
Paper Preview
Abstract
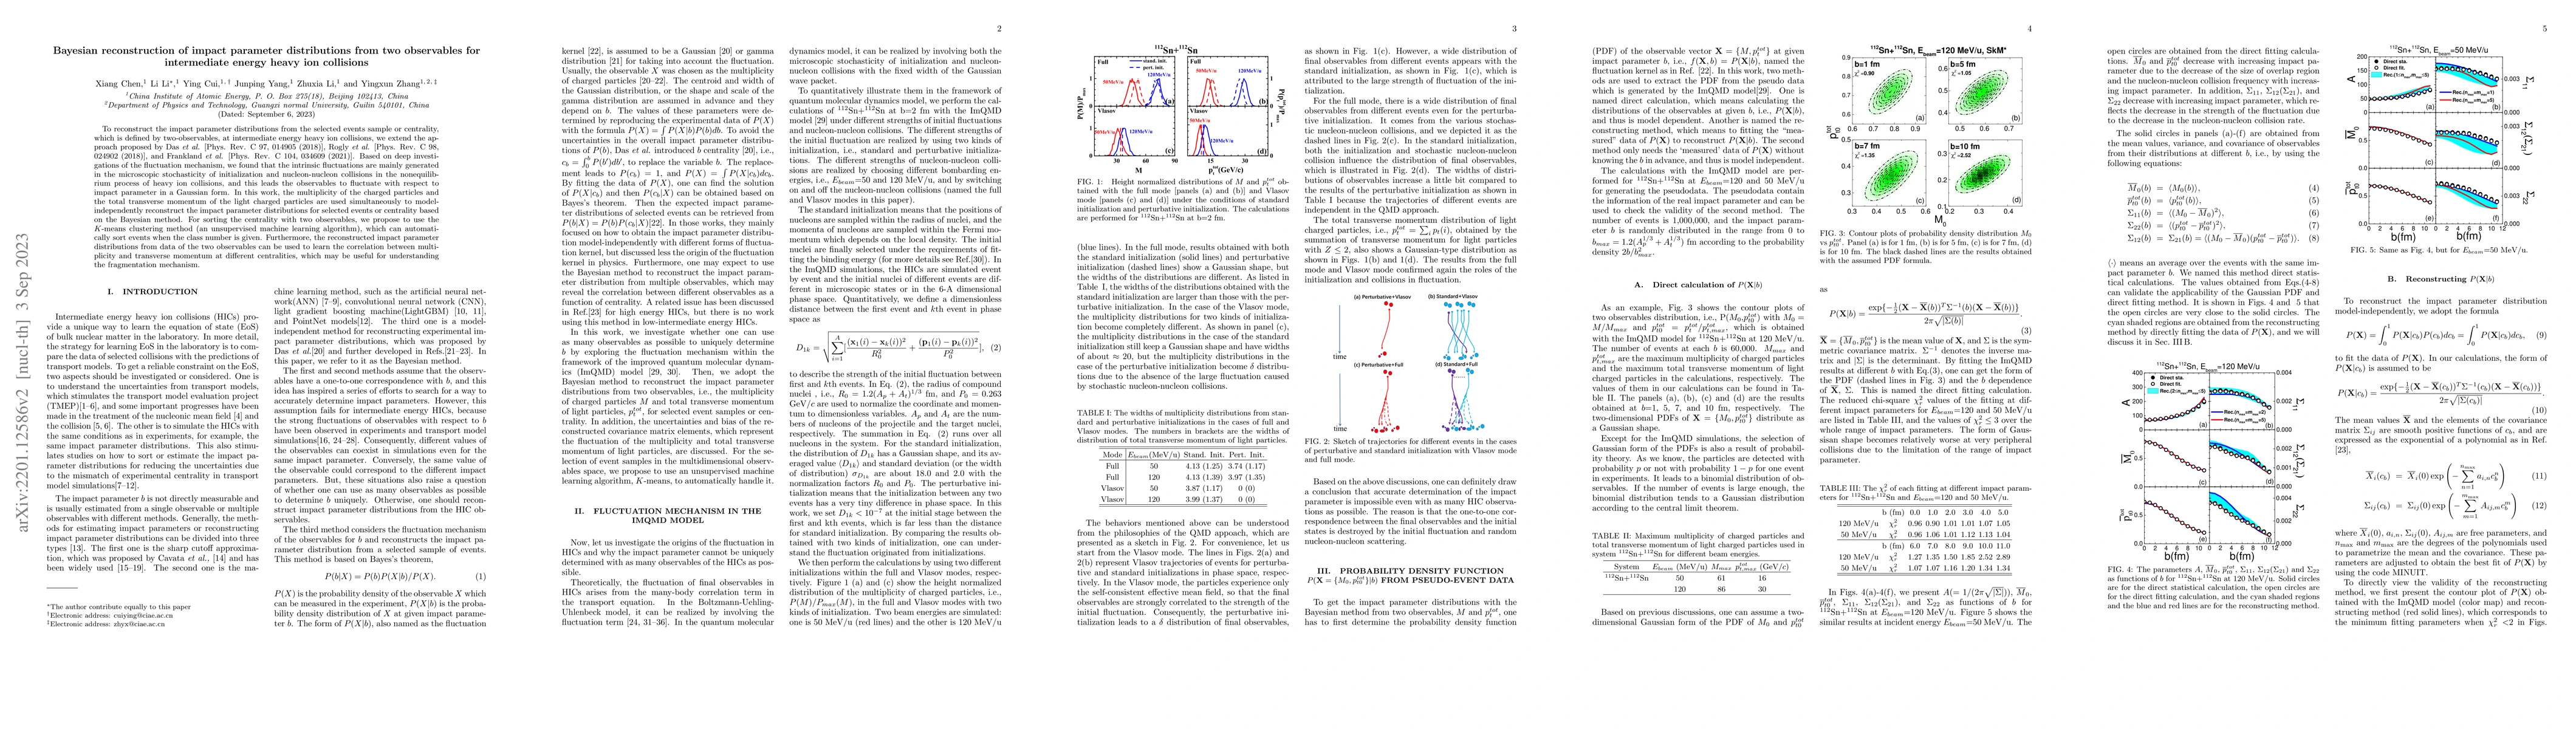
To reconstruct the impact parameter distributions from the selected events sample or centrality, which is defined by two-observables, at intermediate energy heavy ion collisions, we extend the approach proposed by Das \textit{et al.} [Phys. Rev. C 97, 014905 (2018)], Rogly \textit{et al.} [Phys. Rev. C 98, 024902 (2018)], and Frankland \textit{et al.} [Phys. Rev. C 104, 034609 (2021)]. Based on deep investigations of the fluctuation mechanism, we found that the intrinsic fluctuations are mainly generated in the microscopic stochasticity of initialization and nucleon-nucleon collisions in the nonequilibrium process of heavy ion collisions, and this leads the observables to fluctuate with respect to impact parameter in a Gaussian form. In this work, the multiplicity of the charged particles and the total transverse momentum of the light charged particles are used simultaneously to model-independently reconstruct the impact parameter distributions for selected events or centrality based on the Bayesian method. For sorting the centrality with two observables, we propose to use the $K$-means clustering method (an unsupervised machine learning algorithm), which can automatically sort events when the class number is given. Furthermore, the reconstructed impact parameter distributions from data of the two observables can be used to learn the correlation between multiplicity and transverse momentum at different centralities, which may be useful for understanding the fragmentation mechanism.
AI Key Findings
Get AI-generated insights about this paper's methodology, results, significance, and more — seven facets brought into focus.
Impact
Paper Details
Authors
PDF Preview
Key Terms
Citation Network
Current paper (gray), citations (green), references (blue)
Display is limited for performance on very large graphs.
Discussion 0