Summary
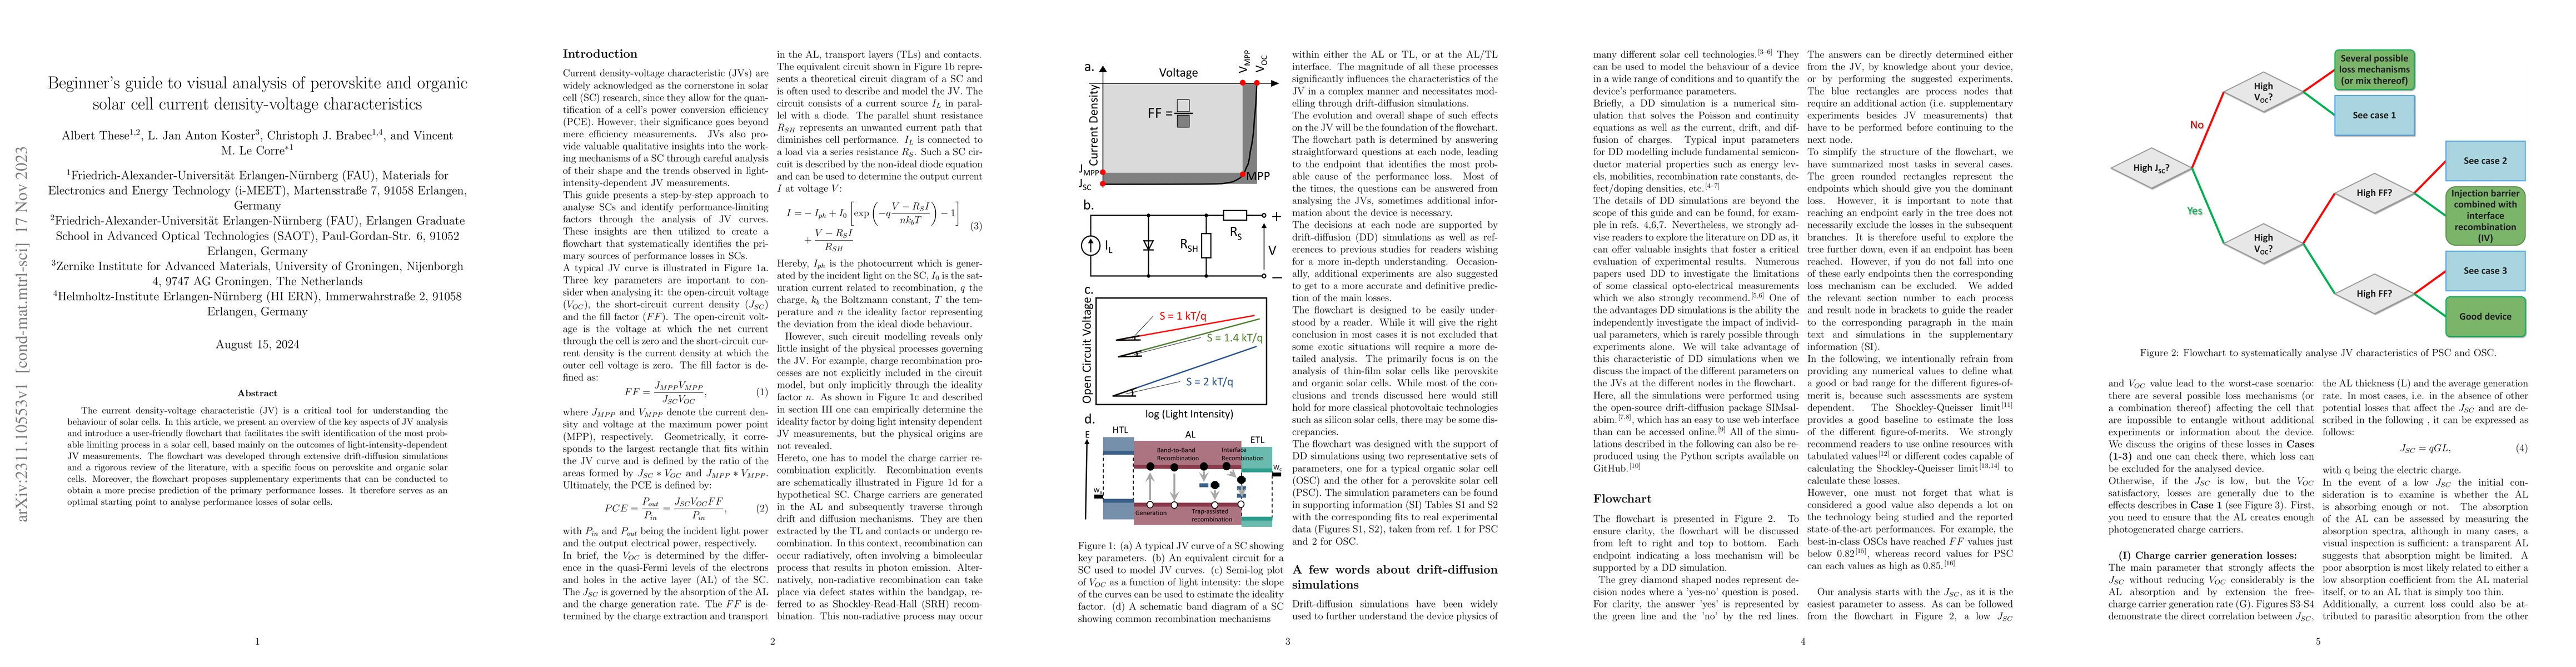
The current density-voltage characteristic (JV) is a critical tool for understanding the behaviour of solar cells. In this article, we present an overview of the key aspects of JV analysis and introduce a user-friendly flowchart that facilitates the swift identification of the most probable limiting process in a solar cell, based mainly on the outcomes of light-intensity-dependent JV measurements. The flowchart was developed through extensive drift-diffusion simulations and a rigorous review of the literature, with a specific focus on perovskite and organic solar cells. Moreover, the flowchart proposes supplementary experiments that can be conducted to obtain a more precise prediction of the primary performance losses. It therefore serves as an optimal starting point to analyse performance losses of solar cells.
AI Key Findings
Get AI-generated insights about this paper's methodology, results, and significance.
Paper Details
PDF Preview
Key Terms
Citation Network
Current paper (gray), citations (green), references (blue)
Display is limited for performance on very large graphs.
Similar Papers
Found 4 papersEvolution of performance parameters of perovskite solar cells with current-voltage scan frequency
Enrique H. Balaguera, Juan Bisquert
| Title | Authors | Year | Actions |
|---|
Comments (0)