Background
Benchmarking large language models has exploded in volume and scope, yet there is little consensus on benchmark reliability. Rankings produced by different benchmarks can diverge; some tests fail to distinguish strong from weak models; and individual items can exhibit inversions where more capable models underperform weaker ones. These issues undermine the trustworthiness of benchmarks as tools for guiding research and deployment. The authors respond with BENCHMARK 2, a framework designed to quantify benchmark quality along three complementary dimensions and to connect benchmark design choices to practical evaluation outcomes.
Problem / Research Question
The central question asks how to quantify and optimize the quality of benchmarks themselves. Specifically, how can we measure (a) consistency of model rankings relative to peer benchmarks, (b) a benchmark’s ability to separate models of different capabilities, and (c) whether tests respect a sane, within-family capability hierarchy for models that share architecture and training lineage? The work also asks whether it is possible to reduce test burdens by selecting high-quality instances without sacrificing comparative fidelity, and how generalizable such selective evaluation is across domains and model families.
Innovation / Contribution
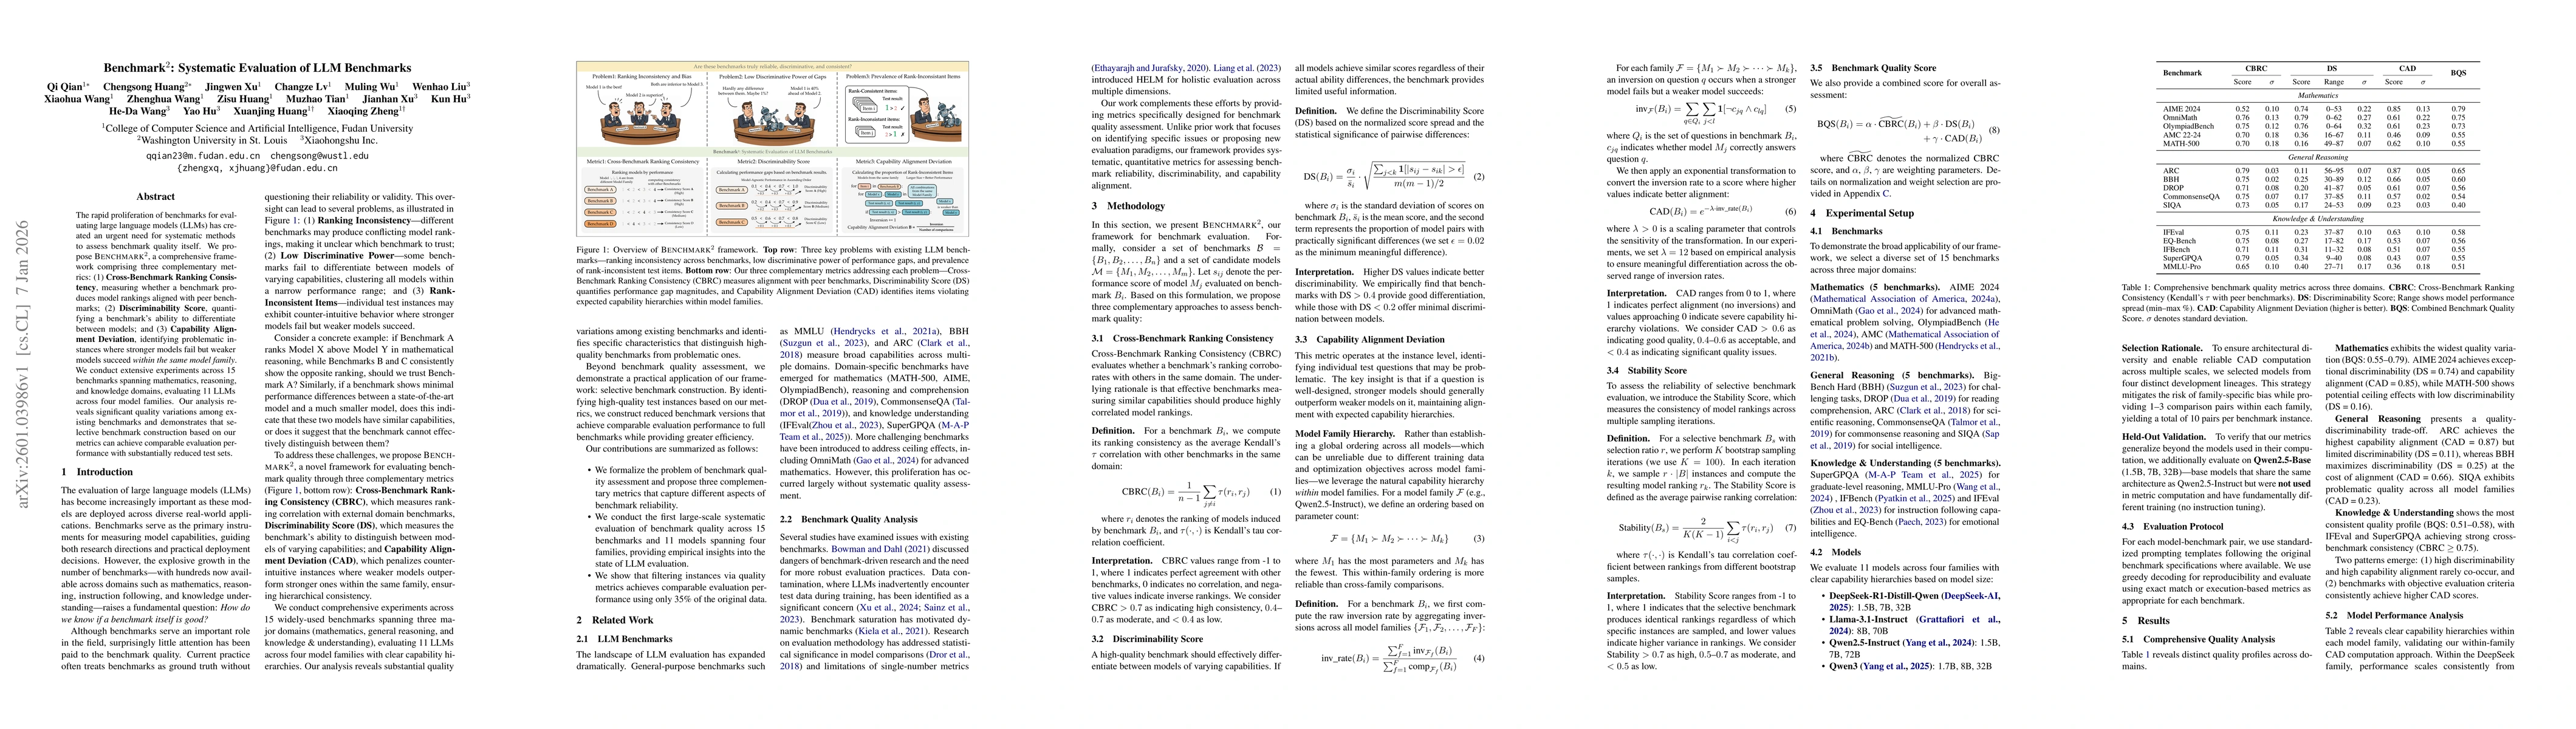
The novelty lies in three metrics that together capture different facets of benchmark reliability: CBRC (Cross-Benchmark Ranking Consistency) for external alignment with peers, DS (Discriminability Score) for discriminative power, and CAD (Capability Alignment Deviation) to penalize within-family inversions. The authors formalize a comprehensive evaluation pipeline across 15 benchmarks in mathematics, general reasoning, and knowledge understanding, using 11 models from four families. They demonstrate how combining CAD and DS enables selective benchmarking that preserves ranking fidelity with far fewer instances and provide practical thresholds and recommendations for benchmark design.
Methodology / Approach
Performance is denoted sij, the score of model j on benchmark i. CBRC uses Kendall’s tau to assess ranking correlation with peer benchmarks, while DS combines the score spread (normalized by mean and standard deviation) with the proportion of model pairs exhibiting practically significant differences (epsilon is a small threshold). CAD imposes a within-family hierarchy by ordering models by size (parameter count) and applying an exponential transformation to inversion rates, yielding a score between 0 and 1 that captures alignment with expected capabilities. A Stability Score tracks ranking consistency across bootstrap samples. The group constructs a Combined Benchmark Quality Score (BQS) by normalizing CBRC, DS, and CAD and weighting them (CAD highest weight due to its instance-level reliability). The experimental setup uses EvalScope for standardized prompting and vLLM for inference, with 500 GPU-hours overall to cover 15 benchmarks and 11 models.
Experiments / Evaluation
Across mathematics, general reasoning, and knowledge domains, BENCHMARK 2 reveals distinct quality profiles. For example, AIME 2024 shows high discriminability (DS = 0.74) and strong capability alignment (CAD = 0.85), while MATH-500 exhibits ceiling effects with low discriminability (DS = 0.16). ARC achieves high CAD (0.87) but low discriminability (DS = 0.11); BBH yields high DS (0.25) but lower CAD (0.66); SIQA tends toward problematic quality (CAD ≈ 0.23). Within-domain analyses show clear hierarchies in model performance, and held-out validation using Qwen2.5-Base demonstrates strong generalization of the selective benchmarking approach: averaging Kendall’s tau of 0.93 when using ~35% of the original instances, and larger models generally retaining or improving ranks on selective benchmarks.
Key Results
Several patterns emerge: high-discriminability benchmarks and strong capability alignment rarely co-occur; objective evaluation criteria correlate with higher CAD; BQS tends to be maximized by tests that balance multiple dimensions. The authors report that perfect rank preservation occurs in Mathematics, with more variation in General Reasoning and Knowledge domains. They show that selecting CAD+DS high instances improves stability to 0.69 while maintaining DS around 0.47, outperforming full benchmarks' stability of 0.59. The results also highlight cross-benchmark correlations (e.g., MATH-500 with AMC 22-24; IFEval with EQ-Bench) and the existence of robust within-family hierarchies that CAD leverages.
Practical Applications
The framework offers concrete guidance for benchmark developers and evaluators: target DS > 0.2 and CAD > 0.6 as practical minimums; prefer objective evaluation criteria; use CAD+DS-driven selective construction to reduce data requirements; monitor family-specific CAD variation as a signal of potential biases; and combine multiple benchmarks to obtain a more reliable, reference-like evaluation. The authors’ workflow, including stability analysis and Lambda-parameter tuning (lambda = 12) for CAD transformations, provides a reproducible blueprint for ongoing benchmark quality monitoring and dynamic degradation detection. These insights are valuable for anyone needing trustworthy LLM evaluation in research, product development, or policy contexts.
Limitations & Considerations
The study explicitly focuses on mathematics, general reasoning, and knowledge understanding, leaving broader domains like code generation and dialogue unexplored. It analyzes text-based benchmarks and a fixed set of model families, with limited representation of proprietary or highly diverse architectures. CAD relies on within-family ordering by model size, which may not always reflect real-world capability progress, and the approach uses an exponential transformation with a chosen lambda, whose sensitivity warrants further validation. Data leakage and contamination concerns persist across benchmarks, and the stability of CBRC and DS under shifting prompts, templates, or evaluation tools remains an open area for scrutiny. Finally, while selective benchmarking reduces cost, it inevitably narrows coverage, and the ideal weights for BQS may shift as benchmarks evolve.
Discussion 0