Benchmarking Graph Representations and Graph Neural Networks for Multivariate Time Series Classification
Publication
Metrics
AI Quick Summary
This paper benchmarks various graph representation learning strategies and Graph Neural Networks (GNNs) for Multivariate Time Series Classification (MTSC), evaluating 60 graph-based MTSC variants across 26 datasets. The results demonstrate that node features are crucial, and adaptive edge learning significantly outperforms other edge feature methods.
Paper Preview
Abstract
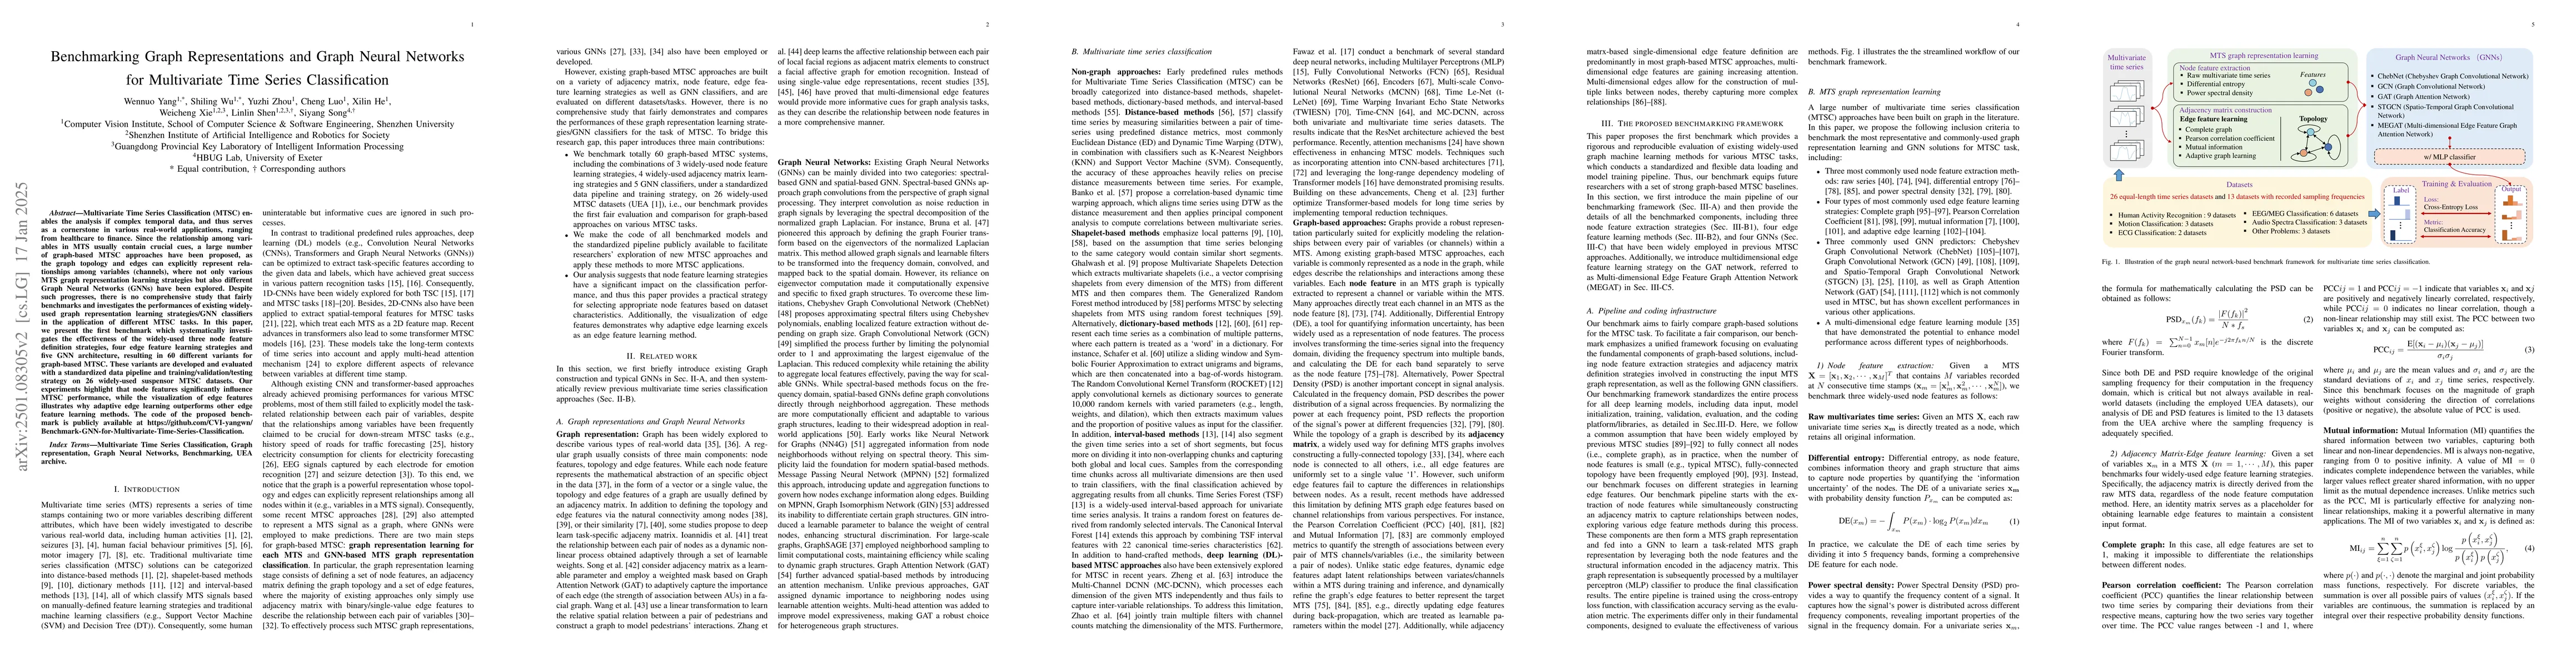
Multivariate Time Series Classification (MTSC) enables the analysis if complex temporal data, and thus serves as a cornerstone in various real-world applications, ranging from healthcare to finance. Since the relationship among variables in MTS usually contain crucial cues, a large number of graph-based MTSC approaches have been proposed, as the graph topology and edges can explicitly represent relationships among variables (channels), where not only various MTS graph representation learning strategies but also different Graph Neural Networks (GNNs) have been explored. Despite such progresses, there is no comprehensive study that fairly benchmarks and investigates the performances of existing widely-used graph representation learning strategies/GNN classifiers in the application of different MTSC tasks. In this paper, we present the first benchmark which systematically investigates the effectiveness of the widely-used three node feature definition strategies, four edge feature learning strategies and five GNN architecture, resulting in 60 different variants for graph-based MTSC. These variants are developed and evaluated with a standardized data pipeline and training/validation/testing strategy on 26 widely-used suspensor MTSC datasets. Our experiments highlight that node features significantly influence MTSC performance, while the visualization of edge features illustrates why adaptive edge learning outperforms other edge feature learning methods. The code of the proposed benchmark is publicly available at \url{https://github.com/CVI-yangwn/Benchmark-GNN-for-Multivariate-Time-Series-Classification}.
AI Key Findings
Get AI-generated insights about this paper's methodology, results, significance, and more — seven facets brought into focus.
Authors
PDF Preview
Related Papers
No references found for this paper.
Discussion 0