Benchmarking survival outcomes: A funnel plot for survival data
Publication
Metrics
AI Quick Summary
This paper develops a methodology for constructing funnel plots to benchmark survival outcomes, specifically for healthcare centers, accounting for censoring and varying censoring distributions. The proposed method is demonstrated using hematopoietic stem cell transplantation data and validated through a simulation study.
Paper Preview
Abstract
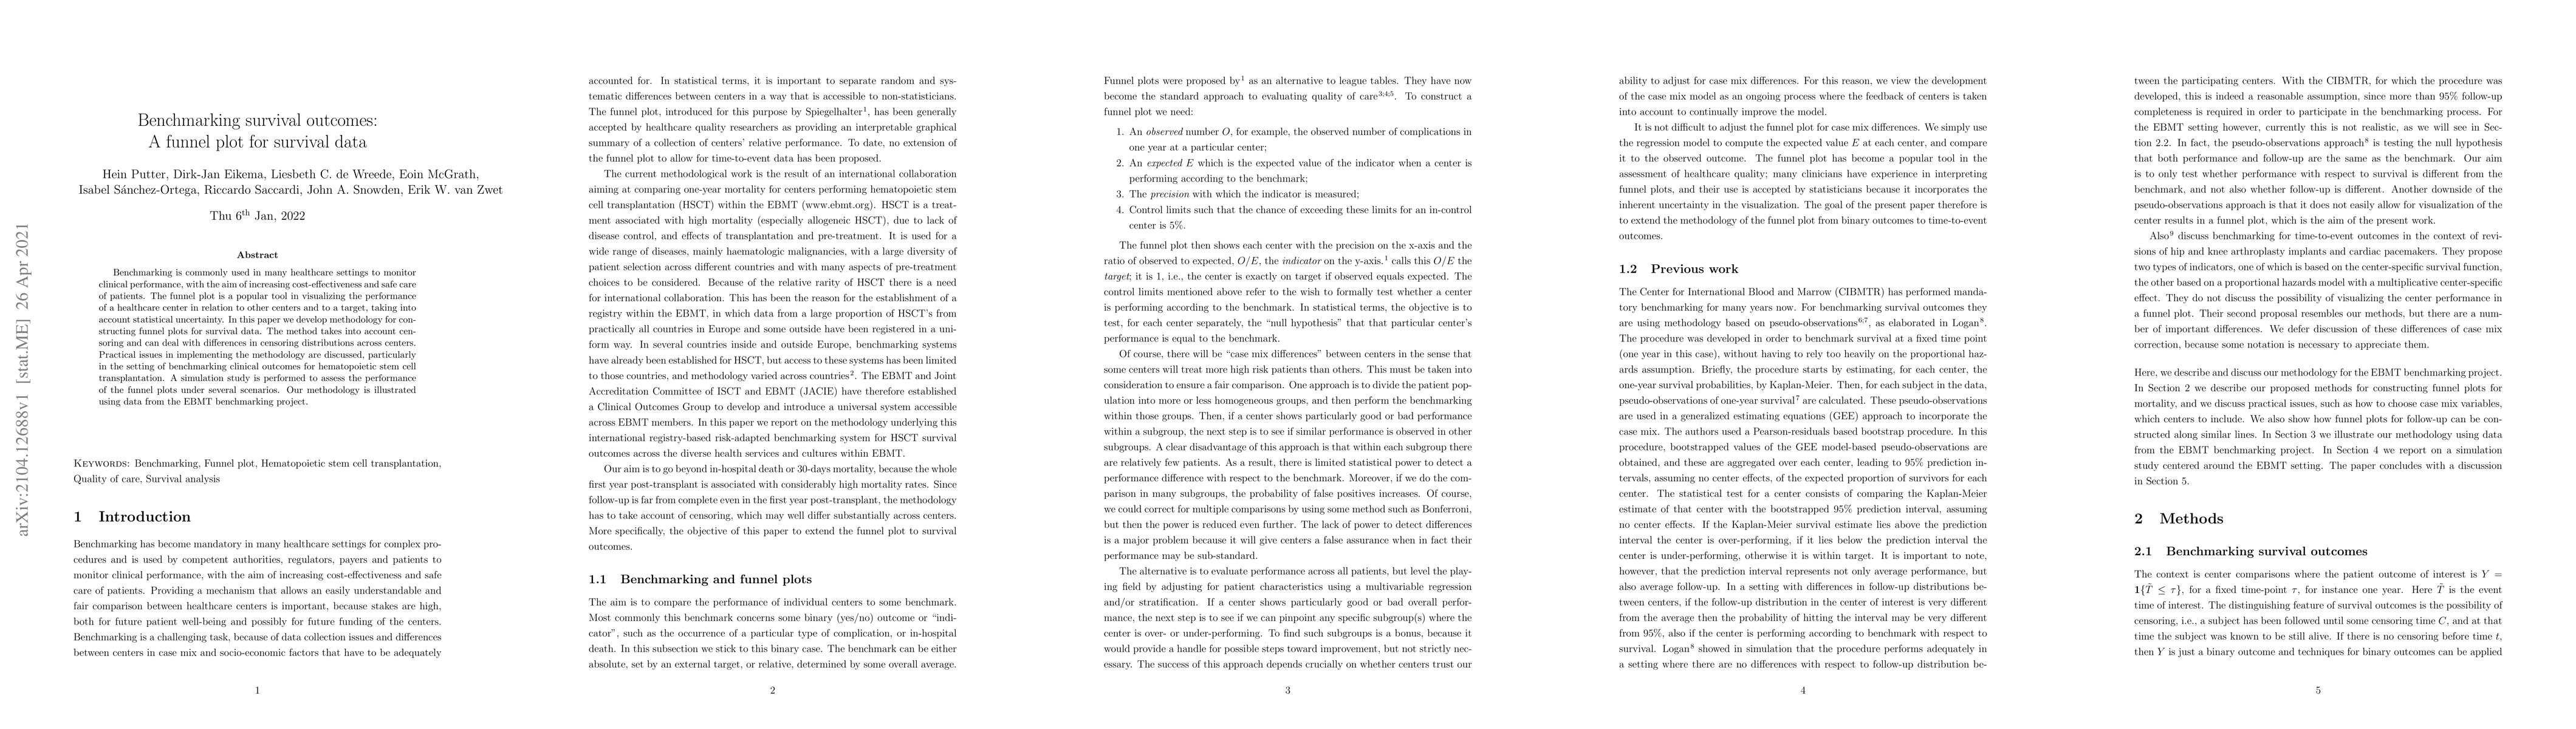
Benchmarking is commonly used in many healthcare settings to monitor clinical performance, with the aim of increasing cost-effectiveness and safe care of patients. The funnel plot is a popular tool in visualizing the performance of a healthcare center in relation to other centers and to a target, taking into account statistical uncertainty. In this paper we develop methodology for constructing funnel plots for survival data. The method takes into account censoring and can deal with differences in censoring distributions across centers. Practical issues in implementing the methodology are discussed, particularly in the setting of benchmarking clinical outcomes for hematopoietic stem cell transplantation. A simulation study is performed to assess the performance of the funnel plots under several scenarios. Our methodology is illustrated using data from the EBMT benchmarking project.
AI Key Findings
Get AI-generated insights about this paper's methodology, results, significance, and more — seven facets brought into focus.
Impact
Paper Details
Authors
PDF Preview
Key Terms
Citation Network
Current paper (gray), citations (green), references (blue)
Display is limited for performance on very large graphs.
Discussion 0