Publication
Metrics
AI Quick Summary
This paper proposes a novel counterfactual guidance method to enhance visual causal inference in exploratory analytics, aiming to reduce complexity while leveraging benefits. Experimental results show that counterfactual guidance improves causal inference performance and alters exploratory behaviors compared to correlation-based methods.
Paper Preview
Abstract
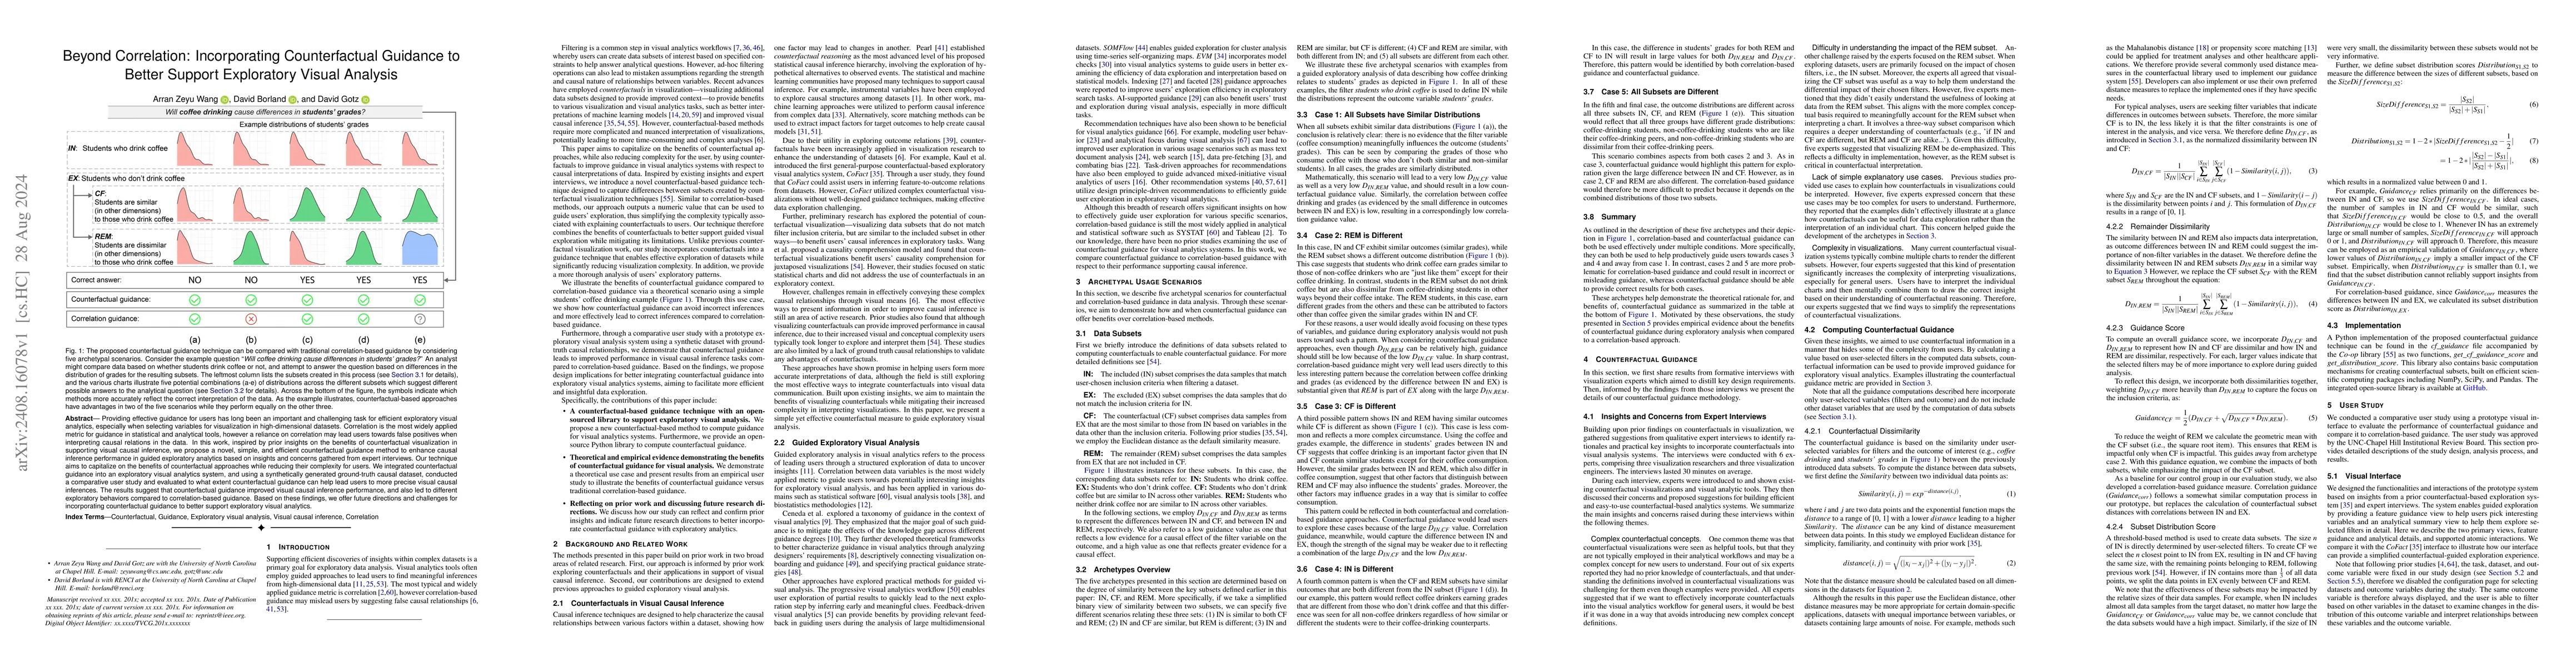
Providing effective guidance for users has long been an important and challenging task for efficient exploratory visual analytics, especially when selecting variables for visualization in high-dimensional datasets. Correlation is the most widely applied metric for guidance in statistical and analytical tools, however a reliance on correlation may lead users towards false positives when interpreting causal relations in the data. In this work, inspired by prior insights on the benefits of counterfactual visualization in supporting visual causal inference, we propose a novel, simple, and efficient counterfactual guidance method to enhance causal inference performance in guided exploratory analytics based on insights and concerns gathered from expert interviews. Our technique aims to capitalize on the benefits of counterfactual approaches while reducing their complexity for users. We integrated counterfactual guidance into an exploratory visual analytics system, and using a synthetically generated ground-truth causal dataset, conducted a comparative user study and evaluated to what extent counterfactual guidance can help lead users to more precise visual causal inferences. The results suggest that counterfactual guidance improved visual causal inference performance, and also led to different exploratory behaviors compared to correlation-based guidance. Based on these findings, we offer future directions and challenges for incorporating counterfactual guidance to better support exploratory visual analytics.
AI Key Findings
Get AI-generated insights about this paper's methodology, results, significance, and more — seven facets brought into focus.
Impact
Authors
PDF Preview
Citation Network
Current paper (gray), citations (green), references (blue)
Display is limited for performance on very large graphs.
Discussion 0