Beyond fixed thresholds: optimizing summaries of wearable device data via piecewise linearization of quantile functions
Publication
Metrics
AI Quick Summary
This paper proposes optimizing summaries of wearable device data by dynamically adjusting thresholds through piecewise linearization of quantile functions, rather than relying on fixed thresholds. It introduces loss functions to measure discrepancies between empirical distributions and threshold-based categorizations, demonstrating improved discriminative power for CGM data in different populations.
Paper Preview
Abstract
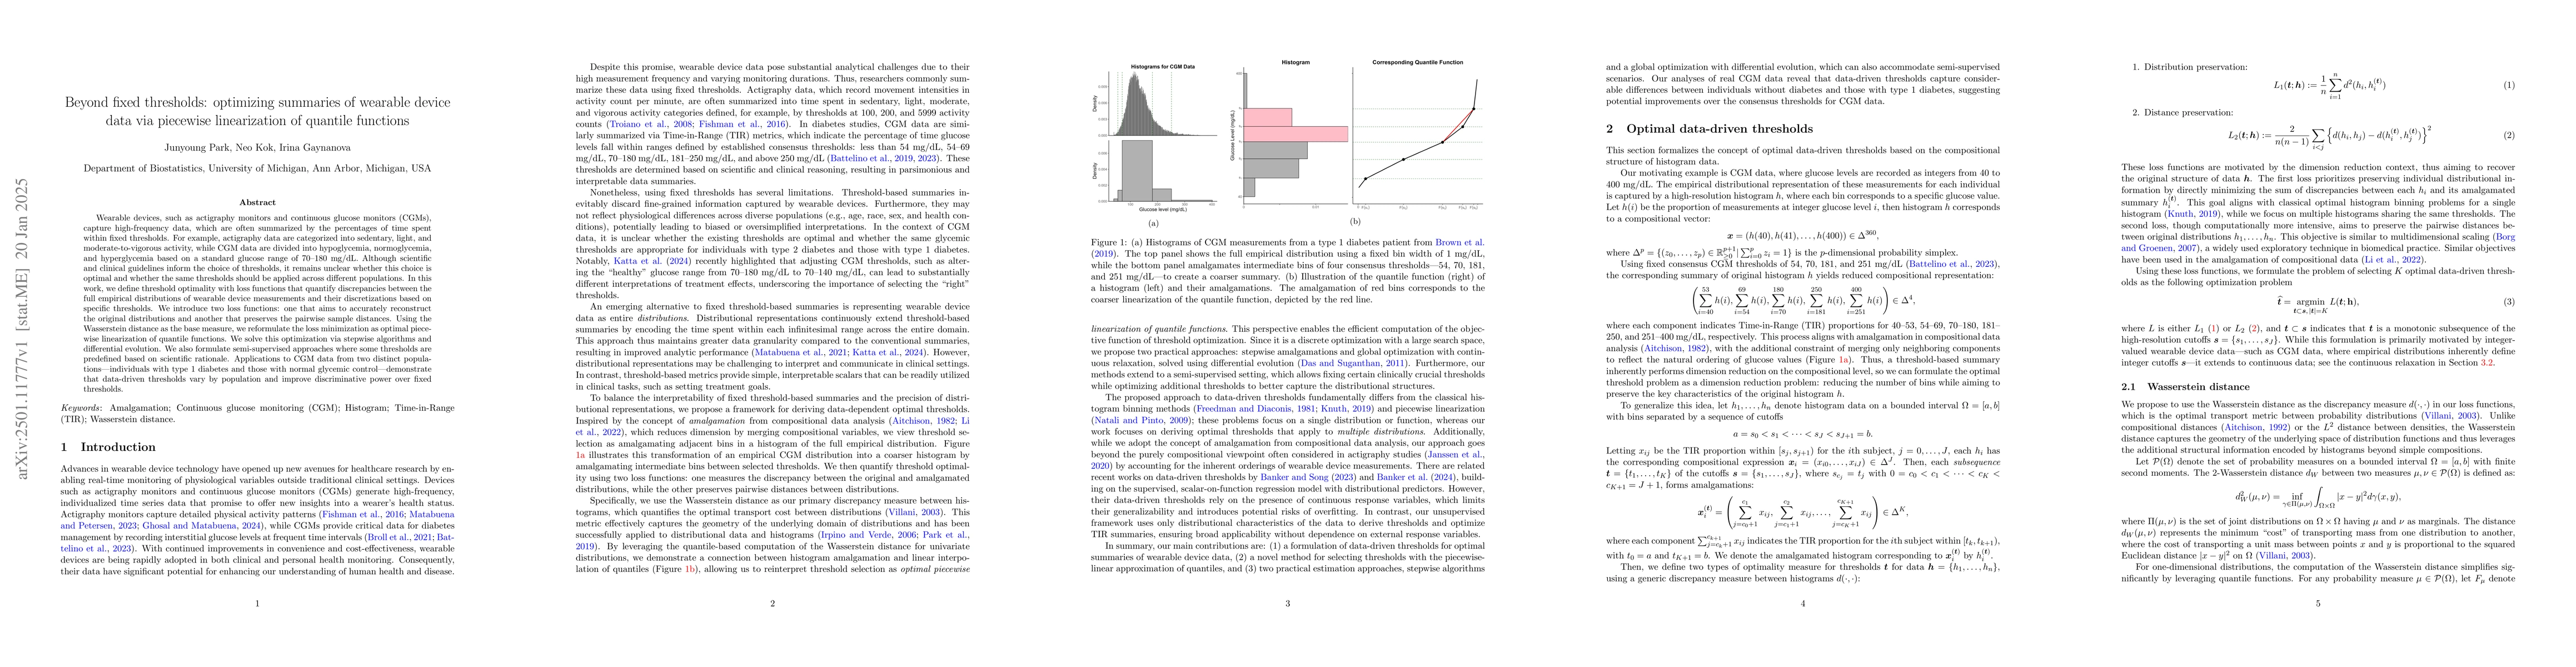
Wearable devices, such as actigraphy monitors and continuous glucose monitors (CGMs), capture high-frequency data, which are often summarized by the percentages of time spent within fixed thresholds. For example, actigraphy data are categorized into sedentary, light, and moderate-to-vigorous activity, while CGM data are divided into hypoglycemia, normoglycemia, and hyperglycemia based on a standard glucose range of $70\unicode{x2013}180$ mg/dL. Although scientific and clinical guidelines inform the choice of thresholds, it remains unclear whether this choice is optimal and whether the same thresholds should be applied across different populations. In this work, we define threshold optimality with loss functions that quantify discrepancies between the full empirical distributions of wearable device measurements and their discretizations based on specific thresholds. We introduce two loss functions: one that aims to accurately reconstruct the original distributions and another that preserves the pairwise sample distances. Using the Wasserstein distance as the base measure, we reformulate the loss minimization as optimal piecewise linearization of quantile functions. We solve this optimization via stepwise algorithms and differential evolution. We also formulate semi-supervised approaches where some thresholds are predefined based on scientific rationale. Applications to CGM data from two distinct populations$\unicode{x2014}$individuals with type 1 diabetes and those with normal glycemic control$\unicode{x2014}$demonstrate that data-driven thresholds vary by population and improve discriminative power over fixed thresholds.
AI Key Findings
Get AI-generated insights about this paper's methodology, results, significance, and more — seven facets brought into focus.
Paper Details
Authors
PDF Preview
Citation Network
Current paper (gray), citations (green), references (blue)
Display is limited for performance on very large graphs.
Related Papers
No references found for this paper.
Discussion 0