Beyond Single Plots: A Benchmark for Question Answering on Multi-Charts
Publication
Metrics
AI Quick Summary
PolyChartQA introduces a mid-scale dataset of 534 multi-chart images with 2,297 sub-charts and 2,694 QA pairs to evaluate question answering over related charts. Nine state-of-the-art multimodal models are tested, revealing a 27.4% drop in accuracy on human-authored questions versus machine-generated prompts, and a 5.39% accuracy gain from a proposed prompting method, highlighting the challenges and potential gains in multi-chart QA.
Paper Preview
Abstract
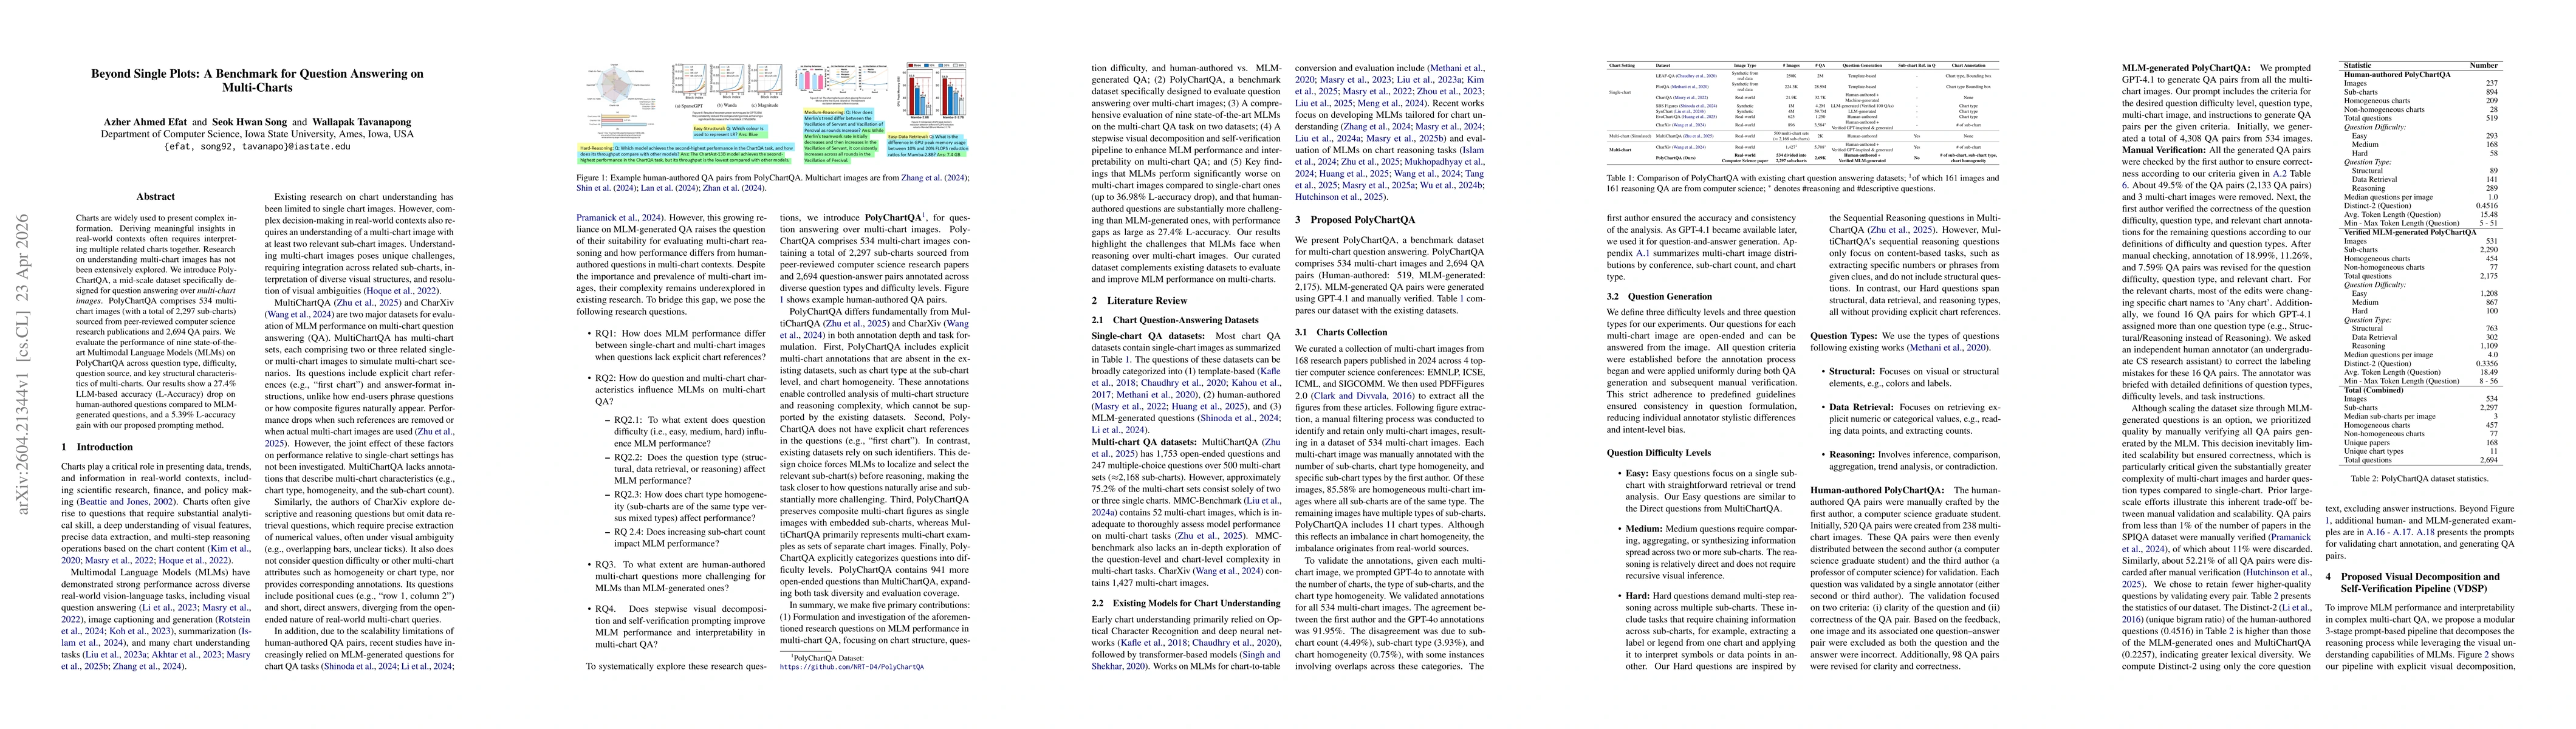
Charts are widely used to present complex information. Deriving meaningful insights in real-world contexts often requires interpreting multiple related charts together. Research on understanding multi-chart images has not been extensively explored. We introduce PolyChartQA, a mid-scale dataset specifically designed for question answering over multi-chart images. PolyChartQA comprises 534 multi-chart images (with a total of 2,297 sub-charts) sourced from peer-reviewed computer science research publications and 2,694 QA pairs. We evaluate the performance of nine state-of-the-art Multimodal Language Models (MLMs) on PolyChartQA across question type, difficulty, question source, and key structural characteristics of multi-charts. Our results show a 27.4% LLM-based accuracy (L-Accuracy) drop on human-authored questions compared to MLM-generated questions, and a 5.39% L-accuracy gain with our proposed prompting method.
AI Key Findings
Get AI-generated insights about this paper's methodology, results, significance, and more — seven facets brought into focus.
Discussion 0